. 2018 Jan 9;27(1):85-100.e8.
doi: 10.1016/j.cmet.2017.10.006. Epub 2017 Nov 9.

CD38-NAD+Axis Regulates Immunotherapeutic Anti-Tumor T Cell Response

Affiliations

CD38-NAD+Axis Regulates Immunotherapeutic Anti-Tumor T Cell Response

Shilpak Chatterjee et al. Cell Metab. .

Abstract

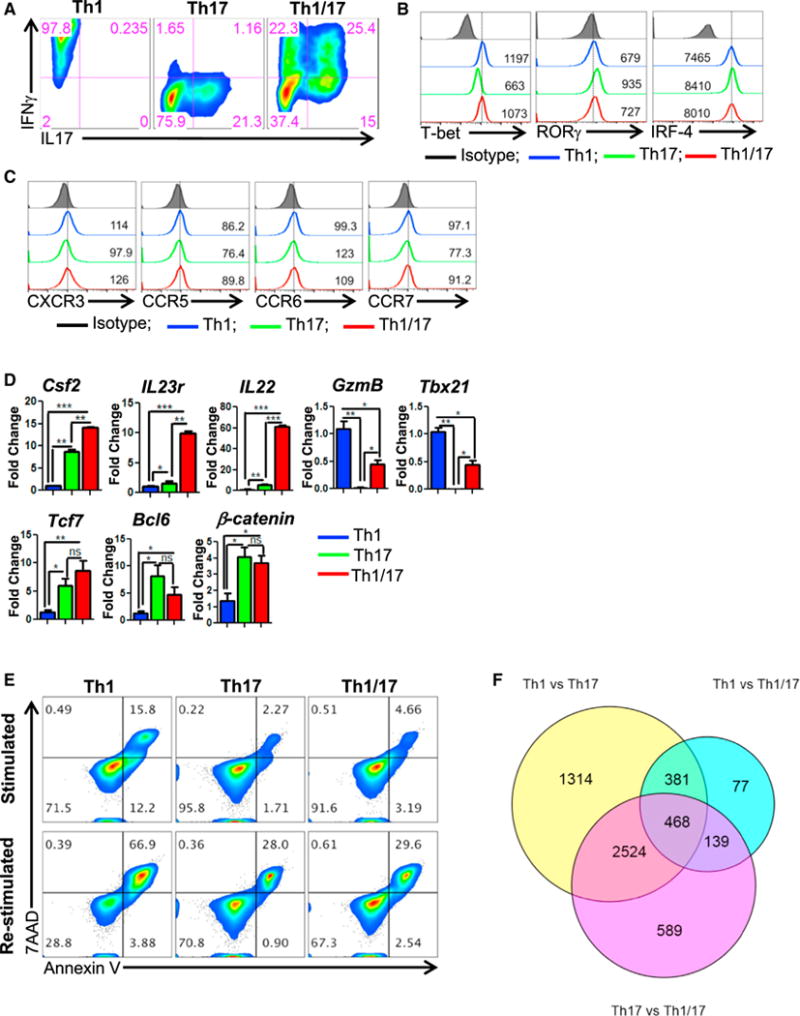
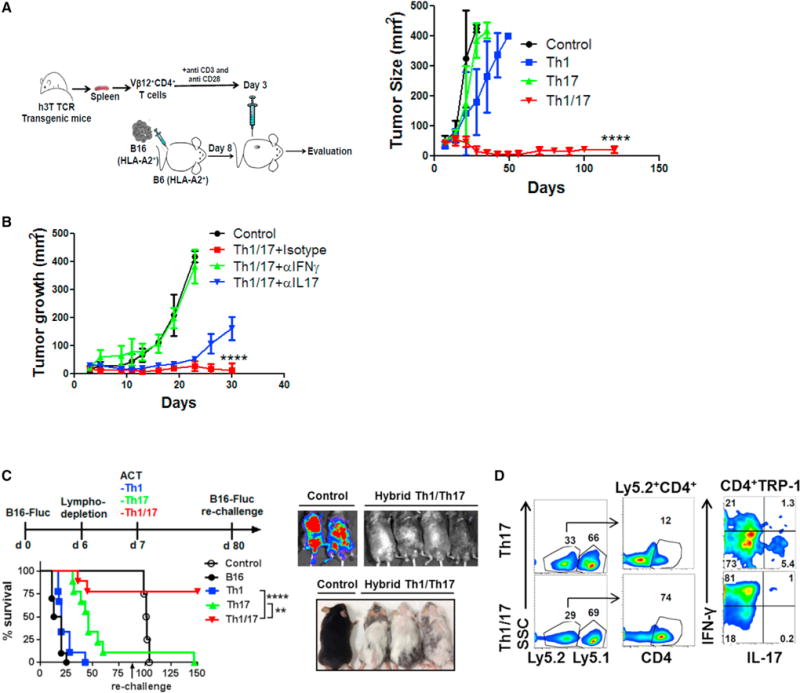
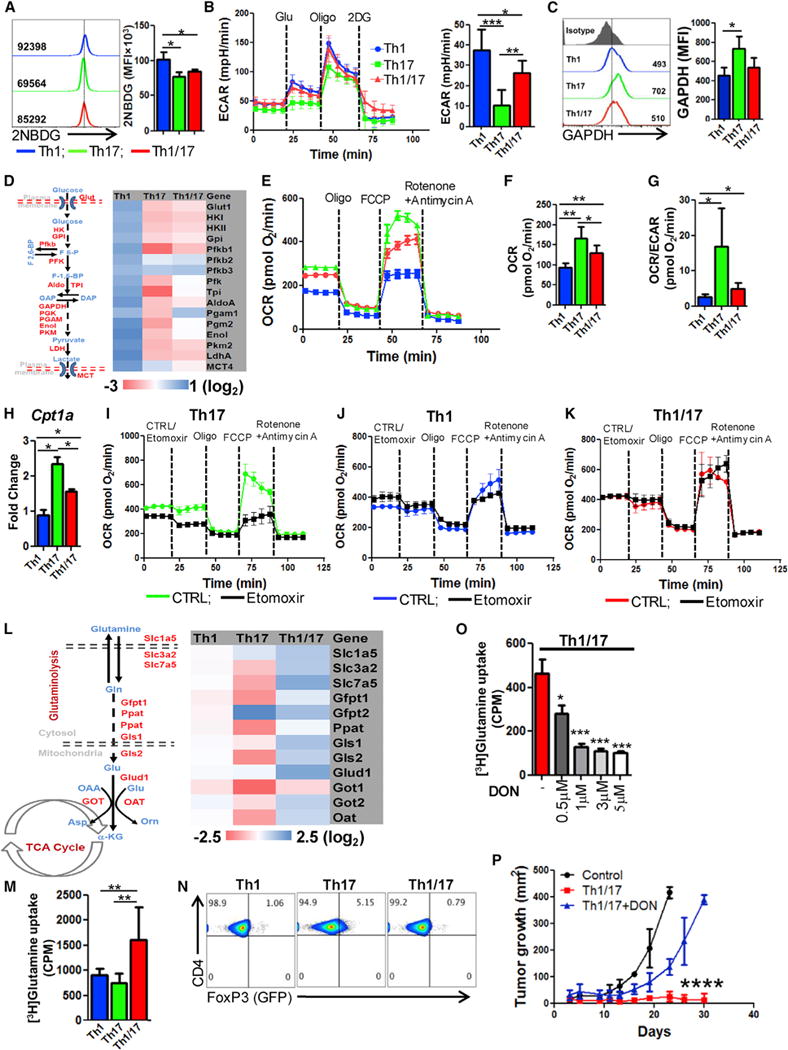
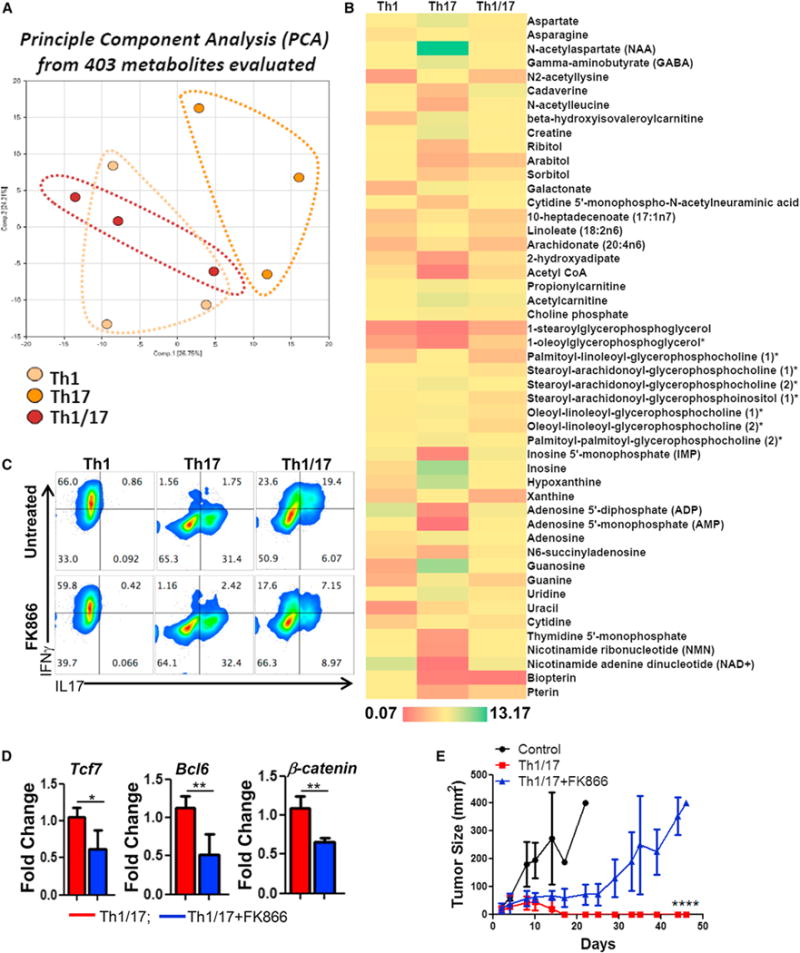
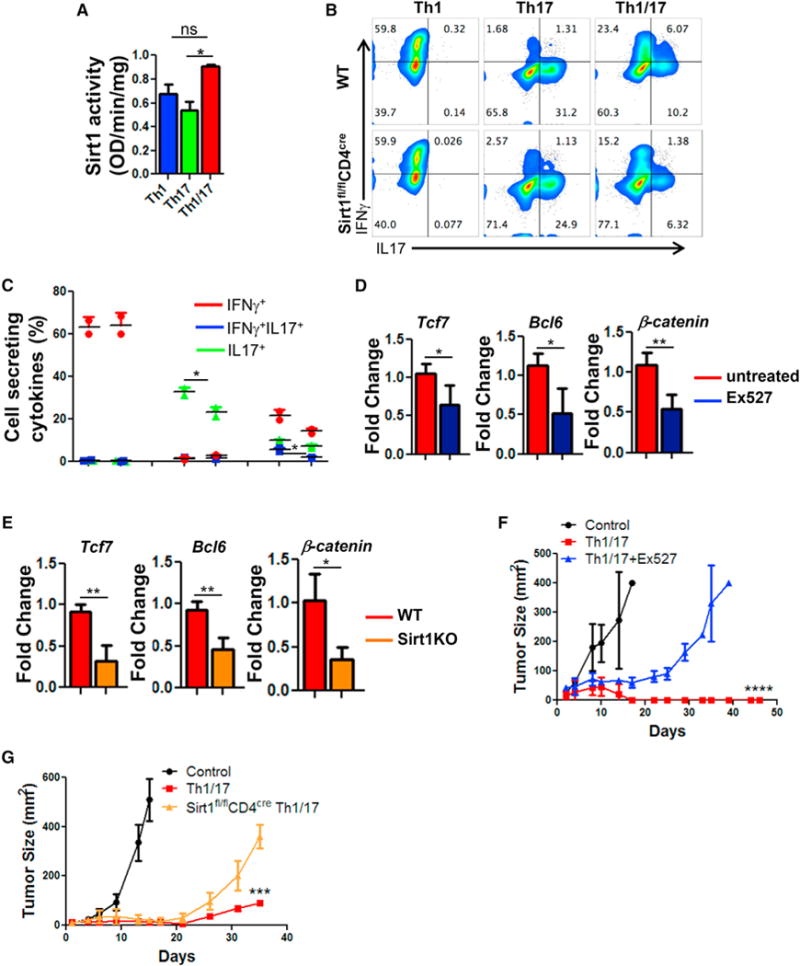
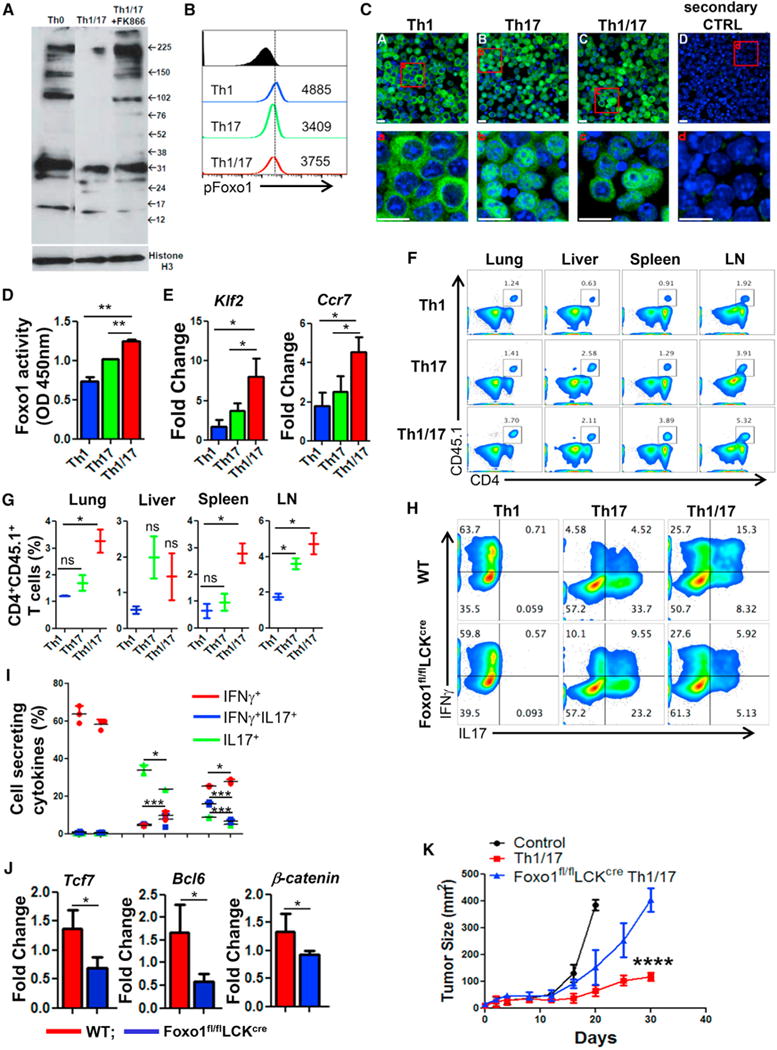
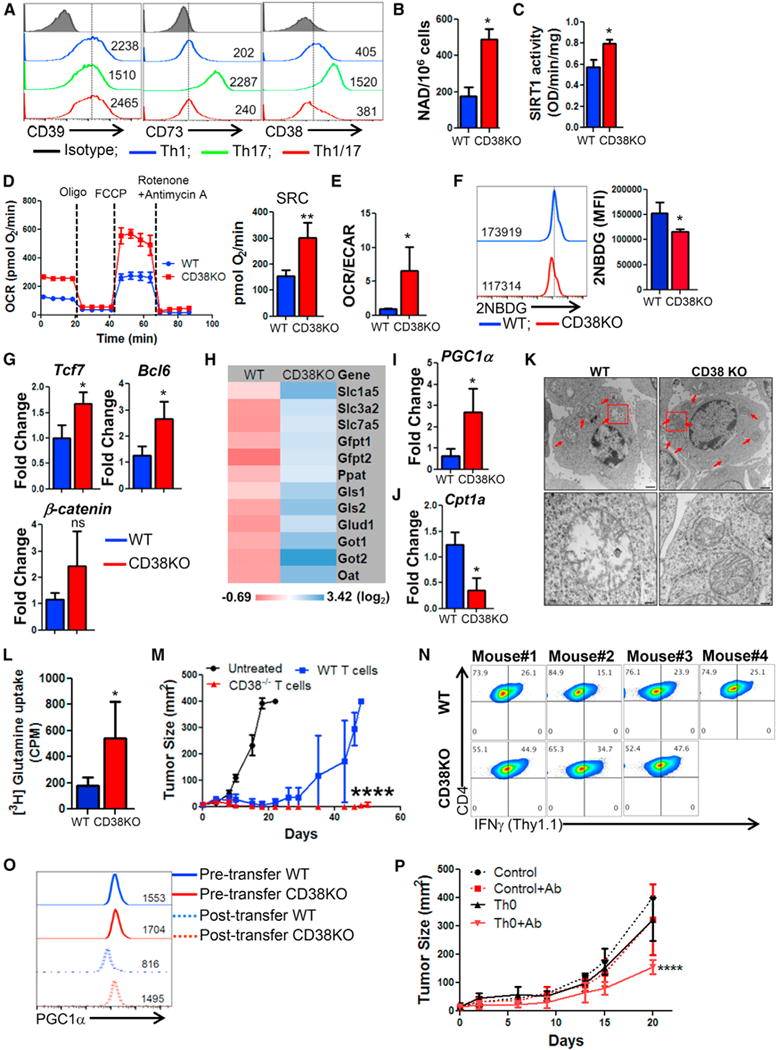
Heightened effector function and prolonged persistence, the key attributes of Th1 and Th17 cells, respectively, are key features of potent anti-tumor T cells. Here, we established ex vivo culture conditions to generate hybrid Th1/17 cells, which persisted long-term in vivo while maintaining their effector function. Using transcriptomics and metabolic profiling approaches, we showed that the enhanced anti-tumor property of Th1/17 cells was dependent on the increased NAD+-dependent activity of the histone deacetylase Sirt1. Pharmacological or genetic inhibition of Sirt1 activity impaired the anti-tumor potential of Th1/17 cells. Importantly, T cells with reduced surface expression of the NADase CD38 exhibited intrinsically higher NAD+, enhanced oxidative phosphorylation, higher glutaminolysis, and altered mitochondrial dynamics that vastly improved tumor control. Lastly, blocking CD38 expression improved tumor control even when using Th0 anti-tumor T cells. Thus, strategies targeting the CD38-NAD+ axis could increase the efficacy of anti-tumor adoptive T cell therapy.


Figures

Figure 1
Figure 1. Hybrid Th1/17 Cells Possess Traits of Both Th1 and Th17 Cells
(A–D) The in vitro differentiated Th1, Th17, and hybrid Th1/17 cells were characterized for (A–C) flow cytometry analysis of (A) intracellular cytokine secretion, (B) Th subset signature transcription factors, (C) Th subset signature chemokine receptor, and (D) qPCR-based mRNA levels for key effector (upper panel) and stemness associated genes (lower panel). (E) Activation induced cell death of different Th subsets after overnight restimulation with anti-CD3 and anti-CD28 antibody. (F) Venn diagram representing the transcripts (obtained after Illumina bead-array) from Th1, Th17, and Th1/17 comparison. *p < 0.05, **p < 0.01, and ***p < 0.005. Also see Figure S1.
Figure 2
Figure 2. Hybrid Th1/17 Cells Exhibit Superior Anti-Tumor Response
(A) Schematic presentation of the experimental strategy (left panel) and the differences observed in tumor growth (right panel) when subcutaneously established B16-A2 tumor in HLA-A+ mice (n = 8 mice/group) were treated by adoptively transferring tyrosinase reactive TIL1383I TCR transgenic T cells differentiated to Th1, Th17, and hybrid Th1/17 cells. Data demonstrate mean tumor size at each time point in one of the three experiments with similar results. (B) C57BL/6 mice with 10 day subcutaneously established B16-F10 melanoma tumor were either kept untreated or treated by transferring 0.5 × 10⁶ TRP-1 Th1/17 cells. The treated group was subdivided to administer 100 μg neutralizing antibody against IFNγ, IL17, or isotype control Ab intraperitoneally every alternate day. Tumor growth curve for various groups with n = 4 is shown. (C) C57BL/6 Ly5.1+ recipients were injected (i.v.) with 0.5 × 10⁶ luciferase-transduced B16-F10 (B16-Fluc) and following lympho-depletion (sub-lethally irradiation with 500 cGy) on day 6. Groups of mice were adoptively transferred with either 0.25 × 10⁶ TRP-1 Th1, Th17, or Th1/17 cells on day 7. Survival and tumor growth (left panel) were followed with bioluminescent imaging. On day 80, recipient mice were re-challenged by injecting 0.5 × 10⁶ B16-Fluc tumors. Survival and tumor growth were followed until day 150 by bioluminescent imaging (upper right). Lower right panel shows that mice receiving hybrid Th1/17 developed a strong vitiligo on the skin. (D) Representative flow panel showed tumor-infiltrating lymphocytes (TILs) recovered from lung on day 150 from Ly5.1+ recipient mice and re-stimulated with PMA and Ionomycin for 4 hr in vitro to measure IFNγ and IL17 secretion. ****p < 0.0001. Also see Figures S2 and S3.
Figure 3
Figure 3. Hybrid Th1/17 Cells Are Metabolically Distinct from Th1 and Th17 Cells and Depend upon Glutaminolysis
(A) The ex vivo programmed Th1, Th17, and Th1/17 cells were used to determine glucose uptake using 2NBDG. Adjacent bar diagram represents the cumulative data of mean fluorescence intensity (MFI) from three independent experiments. (B) ECAR time course in response to glucose, oligomycin, and 2DG (left panel). Adjacent bar shows ECAR levels after glucose addition. (C) Intracellular expression of GAPDH by FACS. Adjacent bar represents cumulative data from three experiments. (D) Glycolysis associated genes using qPCR. (E–G) Oxygen consumption rate (OCR) under basal condition and in response to indicated mitochondrial inhibitors. Graphs representing time course (E), basal OCR (F), and OCR/ECAR ratio (G). (H) Expression of CTP1a using qPCR. (I–K) OCR in presence or absence of etomoxir (200 μM) followed by the addition of various mitochondrial inhibitors as indicated in Th17 (I), Th1 (J), and Th1/17 (K). (L) Expression of various glutaminolysis associated genes using qPCR. (M) Uptake of radiolabelled glutamine that was measured in count per minute (CPM). Data are mean of four replicate samples from the three repeat experiments. (N) FoxP3 expression in FoxP3-GFP knockin CD4+ T cells differentiated to Th1, Th17, and Th1/17 phenotype. (O) Uptake of radiolabelled glutamine in Th1/17 cells cultured in presence of different conc. of DON. Representative data from one of three independent experiments are shown. (P) TRP-1 Th1/17 cells differentiated in the presence of either vehicle control (DMSO) or DON (3 μM) were adoptively transferred (0.5 × 10⁶) in 9 days s.c. established B16-F10 melanoma tumor-bearing mice, and tumor growth was measured. Results for tumor area are the mean of measurements ± SD, from at least four mice per group. *p < 0.05, **p < 0.01, and ***p < 0.005. Also see Figure S4.
Figure 4
Figure 4. Metabolite NAD+ Regulates Hybrid Th1/17 Cell Function
Purified CD4+ T cells differentiated to Th1, Th17, and Th1/17 were used for quantifying intracellular metabolite levels using mass spectrometry. The principle component analysis (PCA) is shown in (A), and (B) shows relative levels of metabolite. Th1, Th17, and Th1/17 cells differentiated in presence of either vehicle control (DMSO) or FK866 (10 nM) were used for determining (C) intracellular cytokine secretion by FACS, (D) expression of stemness-associated genes, and (E) ability to control growth of tumor s.c. established B16-F10-HLA-A2+ murine melanoma cells upon adoptive transfer. Tumor growth was measured using digital calipers every fourth day. Data demonstrate mean tumor size at each time point in one of the two experiments, with similar results. *p < 0.05, **p < 0.01, ***p < 0.005, and ****p < 0.0001. Also see Figure S4.
Figure 5
Figure 5. NAD-SIRT1 Axis Is Central to Th1/17 Anti-Tumor Response
Purified CD4+ T cells differentiated to Th1, Th17, and Th1/17 were used for determining (A) Sirt1 activity using equal amount of nuclear protein (10 μg). Data are presented as activity/mg of protein. (B and C) Flow cytometry analysis (B) and frequency (C) of intracellular cytokines secretion after WT and Sirt1KO T cells were differentiated to Th1/17 cells. Th1/17 cells obtained from WT, Sirt1KO, or WT differentiated in presence of Ex527 were used for (D and E) determining expression of stemness associated genes, (F) B16-F10-HLA-A2+ murine melanoma-established s.c. for 9 days were treated by adoptively transferring 0.5 × 10⁶ TIL1383I TCR transduced T cells differentiated to Th1/17 with or without Ex527, and (G) B16-F10 murine melanoma established s.c. in C57BL/6 mice (n = 5/group) for 9 days were treated by adoptively transferring 0.5 × 10⁶ TRP-1 TCR transduced Th1/17 cells generated either from WT or Sirt-1fl/flCD4Cre mice. Tumor growth was measured using digital calipers every fourth day. Data in figure demonstrate mean tumor size at each time point. *p < 0.05, **p < 0.01, ***p < 0.005, and ****p < 0.0001. Also see Figure S5.
Figure 6
Figure 6. High Foxo1 Activity in Th1/17 Cell Contributes to Enhanced Tumor Control
(A) Determination of global acetylation of nuclear protein in Th0, Th1/17, and Th1/17+FK866 cells using western blot. Membrane was blotted for Histone H3 (bottom panel) for loading correction. (B) Flow cytometry analysis of phosphorylated Foxo1 (S256) in Th1, Th17, and Th1/17 cells. Data are representative of three independent experiments. (C) Confocal images of the indicated cell stained with Foxo1 (in green). Nuclei were stained with DAPI (in blue). Lower panels show the magnified images of the cells in the red box drawn in the upper panels. Scale bar, 10 μm. (D) ELISA-based determination of Foxo1 activity in Th1, Th17, and Th1/17 cells. Data are means ± SD of two samples from one representative experiment out of three. (E) qPCR analysis of the expression of Klf2 and Ccr7 in differentiated Th1, Th17, and Th1/17 cells. (F and G) Flow cytometric analysis (F) and frequency (G) of donor cells (Ly5.1+) retrieved from the lung, liver, spleen, and lymph nodes 24 hr after adoptive transfer of Th1, Th17, and Th1/17 cells into wild-type mice (Ly5.2+). (H–J) WT or Foxo1fl/flLckcre CD4+T cells differentiated to Th1, Th17, and Th1/17 cells were used to determine (H) intracellular cytokine secretion, (I) frequency of cells secreting cytokines, and (J) stemness-associated genes using qPCR. (K) C57BL/6 mice (n = 4 mice/group) with subcutaneously established B16-F10 melanoma for 9 days were either kept untreated or adoptively transferred with 0.5 × 10⁶ TRP-1 TCR transduced Th1/17 cells from either WT or Foxo1fl/flLckcre mice. The tumor growth curve from various groups of recipient mice is shown. Data are representative of three independent experiment in (H)–(J) and from two independent experiments, with similar result in (I). *p < 0.05, **p < 0.01, ***p < 0.005, and ****p < 0.0001. Also see Figure S6.
Figure 7
Figure 7. Inverse Correlation between CD38 and NAD+ Regulates Anti-Tumor Property of T Cells
(A) Purified CD4+ T cells differentiated to Th1, Th17, and Th1/17 were used for determining the relative expression of cell surface molecules involved in canonical and non-canonical adenosinergic pathways. Splenic CD4+ T cells from C57BL/6 WT and CD38KO mice after 3 days of TCR activation were used to determine (B) intracellular NAD+ levels and (C) nuclear Sirt1 activity. TCR activated WT and CD38KO CD4+ T cells were used for determining (D) time course of OCR (left panel) and SRC (right panel), and (E) basal OCR/ECAR ratio. (F) Glucose uptake by using fluorescent-labeled glucose analog 2-NBDG. Adjacent bar diagram represents the cumulative data of mean fluorescence intensity (MFI) from three independent experiments. (G–J) qPCR analysis of the expression of (G) various stemness-associated genes, (H) glutaminolysis-associated genes, (I) PGC1α expression, and (J) Cpt1a expression. (K) Transmission electron microscopy of activated WT and CD38KO CD4+ T cells. Lower panels show the magnified images of the cells in the red box drawn in the upper panels. Scale bar, 1 μM (upper panel) and 200 nM (lower panel). (L) Uptake of radiolabelled glutamine measured in count per minute (CPM) is presented from one of two independent experiments. (M) Anti-tumor ability upon adoptive transfer of 0.5 × 10⁶ tyrosinase reactive TIL1383I TCR transduced CD4+ T cells from either C57BL/6 IFNγThy1.1 or CD38KO-IFNγThy1.1 mice to HLA-A+ mice (N = 8/group) with s.c. established B16-F10-HLA-A2+ murine melanoma cells. Data from one of the two experiments with similar results is shown. (N) Tumor infiltrating lymphocytes from the treated mice (as in M) were retrieved, and expression of Thy1.1 (≈IFN-γ) was evaluated in CD4+ Vb12+ cells using flow cytometry. (O) Flow cytometry analysis for intranuclear expression of PGC1α was performed using the WT or CD38KO CD4+ T cell retrieved 24 hr after injection to the ascites of EL-4 ascites tumor-bearing mice (n = 2). PGC1α expression pre- and post-injection is shown. (P) C57BL/6 mice (n = 4–5 mice/group) with 9 days subcutaneously established B16-F10 melanoma tumor were either kept untreated or adoptively transferred with 1 × 10⁶ TRP-1 CD4+ T cells (Th0). Group of mice that received T cells were either kept untreated or injected with anti-CD38 Ab (50 μg/mouse; i.p.) three times in a week up to day 20. Shown is the tumor growth curve of various groups of recipient mice. *p < 0.05, **p < 0.01, ***p < 0.005, and ****p < 0.0001. Also see Figure S7.

Comment in

References

    1. Benjamini Y, Hochberg Y. Controlling the false discovery rate: a practical and powerful approach to multiple testing. J R Stat Soc B. 1995;57:289–300.
    1. Bruzzone S, Fruscione F, Morando S, Ferrando T, Poggi A, Garuti A, D’Urso A, Selmo M, Benvenuto F, Cea M, et al. Catastrophic NAD+ depletion in activated T lymphocytes through Nampt inhibition reduces demyelination and disability in EAE. PLoS One. 2009;4:e7897. - PMC - PubMed
    1. Buck MD, O’Sullivan D, Klein Geltink RI, Curtis JD, Chang CH, Sanin DE, Qiu J, Kretz O, Braas D, van der Windt GJ, et al. Mitochondrial dynamics controls T cell fate through metabolic programming. Cell. 2016;166:63–76. - PMC - PubMed
    1. Buck MD, O’Sullivan D, Pearce EL. T cell metabolism drives immunity. J Exp Med. 2015;212:1345–1360. - PMC - PubMed
    1. Camacho-Pereira J, Tarragó MG, Chini CCS, Nin V, Escande C, Warner GM, Puranik AS, Schoon RA, Reid JM, Galina A, Chini EN. CD38 dictates age-related NAD decline and mitochondrial dysfunction through an SIRT3-dependent mechanism. Cell Metab. 2016;23:1127–1139. - PMC - PubMed

Publication types