. 2017 Nov 13;8(1):1456.
doi: 10.1038/s41467-017-01744-5.

A post-transcriptional program coordinated by CSDE1 prevents intrinsic neural differentiation of human embryonic stem cells

Affiliations

A post-transcriptional program coordinated by CSDE1 prevents intrinsic neural differentiation of human embryonic stem cells

Hyun Ju Lee et al. Nat Commun. .

Abstract

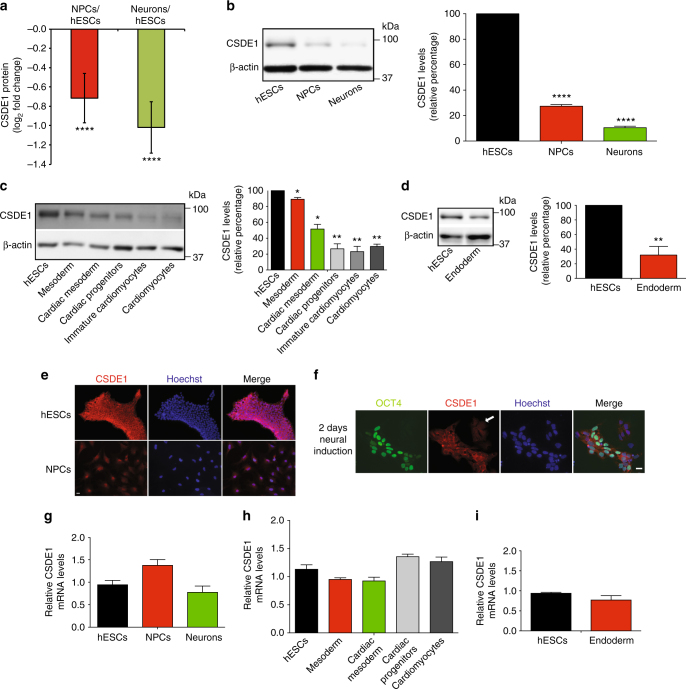
While the transcriptional network of human embryonic stem cells (hESCs) has been extensively studied, relatively little is known about how post-transcriptional modulations determine hESC function. RNA-binding proteins play central roles in RNA regulation, including translation and turnover. Here we show that the RNA-binding protein CSDE1 (cold shock domain containing E1) is highly expressed in hESCs to maintain their undifferentiated state and prevent default neural fate. Notably, loss of CSDE1 accelerates neural differentiation and potentiates neurogenesis. Conversely, ectopic expression of CSDE1 impairs neural differentiation. We find that CSDE1 post-transcriptionally modulates core components of multiple regulatory nodes of hESC identity, neuroectoderm commitment and neurogenesis. Among these key pro-neural/neuronal factors, CSDE1 binds fatty acid binding protein 7 (FABP7) and vimentin (VIM) mRNAs, as well as transcripts involved in neuron projection development regulating their stability and translation. Thus, our results uncover CSDE1 as a central post-transcriptional regulator of hESC identity and neurogenesis.


Conflict of interest statement

The authors declare no competing financial interests.

Figures

Fig. 1
Fig. 1
The levels of CSDE1 protein decrease during hESC differentiation. a Quantitative proteomic analysis of CSDE1 levels comparing H9 hESCs with their NPC and neuronal counterparts. Graph represents the mean (±confidence interval) of relative abundance differences calculated from the log2 of label-free quantification (LFQ) values (hESCs (n = 9), NPCs (n = 6) and neurons (n = 5)). Statistical comparisons were made by limma’s moderated t-test (P-value: **** (P < 0.0001)). b Western blot analysis with antibody to CSDE1. The graph represents the CSDE1 relative percentage values (corrected for β-actin loading control) to H9 hESCs (mean ± s.e.m. of five independent experiments). c Western blot of CSDE1 in H1 hESCs and their differentiated mesoderm and cardiomyocyte counterparts. The graph represents the CSDE1 relative percentage values (corrected for β-actin loading control) to H1 hESCs (mean ± s.e.m. of two independent experiments). d Western blot analysis with antibody to CSDE1. The graph represents the CSDE1 relative percentage values (corrected for β-actin loading control) to H9 hESCs (mean ± s.e.m. of three independent experiments). e Immunocytochemistry of H9 hESCs and NPCs (2 weeks under neural induction treatment) with antibody to CSDE1. Hoechst staining was used as a marker of nuclei. Scale bar represents 20 μm. f Immunocytochemistry of cell cultures at early stages of the neural induction treatment (2 days) with antibody to CSDE1. OCT4 and Hoechst staining were used as markers of pluripotency and nuclei, respectively. These cultures contain undifferentiated (OCT4-positive) and differentiated (OCT4-negative) cells. White arrow indicates OCT4-negative cells. Scale bar represents 20 μm. g Quantitative PCR (qPCR) analysis of CSDE1 mRNA levels. Graph (CSDE1 relative expression to H9 hESCs) represents the mean ± s.e.m. of three independent experiments. h CSDE1 relative expression to H1 hESCs represents the mean ± s.e.m. of three independent experiments with three biological replicates. i CSDE1 relative expression to H9 hESCs represents the mean ± s.e.m. of two independent experiments with three biological replicates. In bd and gi, statistical comparisons were made by Student’s t-test for unpaired samples. P-value: *(P < 0.05), **(P < 0.01), **** (P < 0.0001)
Fig. 2
Fig. 2
CSDE1 protein levels decrease with differentiation in developing mouse embryonic tissues. a Western blot analysis with antibody to CSDE1 of mouse ESCs (mESCs) and derived NPCs. The graph represents the CSDE1 relative percentage values (corrected for GAPDH loading control) to mESCs (mean ± s.e.m. of two independent experiments). b Immunocytochemistry of mESCs and differentiated cells with antibody to CSDE1. NANOG and DAPI staining were used as markers of pluripotency and nuclei, respectively. Scale bar represents 20 μm. c Western blot analysis of primitive streak and streak-enriched tissues (posterior) and neural plate and neural-enriched tissues (anterior) from mouse embryos (embryonic day (E)8.5)). T (brachyury) and SOX2 staining were used as markers of posterior and anterior parts, respectively. The graph represents the CSDE1 relative percentage values (corrected for GAPDH loading control) to posterior part (mean ± s.e.m. of three independent experiments). All the statistical comparisons were made by Student’s t-test for unpaired samples. P-value: *(P < 0.05), **** (P < 0.0001)
Fig. 3
Fig. 3
CSDE1 prevents neural differentiation of hESCs. a Brightfield images of H9 hESCs. Knockdown of CSDE1 results in the proliferation of flattened and elongated cells that grew in monolayer colonies with reduced cell contact. Furthermore, loss of CSDE1 induces a spontaneous differentiation into neuronal cells. Scale bar represents 250 μm. b Percentage of alkaline phosphatase (AP)-positive colonies after five days of culturing without removing differentiated cells. Graph represents the mean ± s.e.m. of the percentage observed in four independent experiments (we assessed approximately 150 total colonies in each independent experiment). c qPCR analysis of hESCs cultured for five days without removal of differentiated cells. Graph (relative expression to non-targeting (NT) shRNA) represents the mean ± s.e.m. of four independent experiments with three biological replicates. d Western blot analysis with antibodies to CSDE1, OCT4 and SOX2. β-actin is the loading control. hESCs were grown for five days without removing differentiated cells. e Immunocytochemistry of H9 hESCs grown for five days without removal of differentiated cells. OCT4, PAX6, and Hoechst staining were used as markers of pluripotency, neuroectodermal differentiation, and nuclei, respectively. Scale bar represents 20 μm. fj Graphs represent the percentage (mean ± s.e.m.) of OCT4 and PAX6-positive cells/total nuclei after five days in culture without removal of differentiated cells: f H9 hESCs, n = 3 independent experiments, 550–700 total cells per experiment; g H9 hESCs, n = 3, 420–1000 cells per experiment; h H1 hESCs, n = 3, 290–960 cells per experiment; i HUES9 hESCs, n = 3, 320–710 cells per experiment; j HUES6 hESCs, n = 3, 200–550 cells per experiment. KD = CSDE1 knockdown. KO = CSDE1 knockout. All the statistical comparisons were made by Student’s t-test for unpaired samples. P-value: *(P < 0.05), **(P < 0.01), ***(P < 0.001), **** (P < 0.0001)
Fig. 4
Fig. 4
Loss of CSDE1 promotes neural differentiation and neurogenesis. a Percentage of OCT4 and PAX6-positive cells/total nuclei at different days after neural induction of undifferentiated H9 hESC colonies (mean ± s.e.m. of three independent experiments, 200 total cells per experiment). b qPCR analysis after 10 days of neural induction. Data (relative expression to NT shRNA cells) represent two independent experiments with three biological replicates. c qPCR analysis of neuronal markers after 10 days of pan-neuronal differentiation. Graph (relative expression to NT shRNA) represents the mean ± s.e.m. of three independent experiments with three biological replicates. d Immunocytochemistry after 7 and 21 days of neuronal induction. MAP2, GFAP, and Hoechst staining were used as markers of neurons, astrocytes, and nuclei, respectively. Scale bar represents 20 μm. e qPCR analysis of endoderm markers upon definitive endodermal differentiation of undifferentiated H9 hESCs. Graph (relative expression to NT shRNA) represents the mean ± s.e.m. of three independent experiments with two biological replicates. All the statistical comparisons were made by Student’s t-test for unpaired samples. P-value: *(P < 0.05), **(P < 0.01), ***(P < 0.001), **** (P < 0.0001)
Fig. 5
Fig. 5
Knockdown of CSDE1 impairs post-transcriptional regulation of FABP7 and VIM. a Polysome profiles indicate no differences in the ribosome pool upon CSDE1 knockdown (graph is representative of 3 independent experiments). b Western blot analysis with antibodies to CSDE1, OCT4, PAX6, FABP7 and VIM of H9 hESCs daily monitored to remove differentiated cells. β-actin is the loading control. c Graph (relative expression to NT shRNA H9 hESCs) represents the mean ± s.e.m. of three independent experiments with three biological replicates. d Ribonucleoprotein immunoprecipitation (RIP) with CSDE1 antibody. Quantitative PCR analysis of the indicated genes is expressed as fold enrichment over RIP performed with FLAG control antibody. Graph (relative enrichment to FLAG antibody) represents the mean ± s.e.m. (n = 4 independent experiments). e mRNA levels were determined after the indicated time of actinomycin D (ActD) treatment (5 μg ml1) by qPCR. For each gene, the right graph corresponds to a representative experiment showing the percentage of mRNA relative to time = 0. In the left panel, mRNA degradation is shown as relative slope to non-targeting (NT) shRNA hESCs (mean ± s.e.m. of five independent experiments). The time course experiments with ActD treatment were established for every gene depending on the mRNA degradation rates observed in the NT shRNA samples. f Polysome profiling experiments followed by qPCR analysis. Total and polysome fractions mRNA levels are expressed as relative values to total and polysome fractions of NT shRNA hESCs, respectively. Graph represents the mean ± s.e.m. (n = 4 independent experiments). In c, d and e the statistical comparisons were made by Student’s t-test for unpaired samples. In f the statistical comparisons were made by Student’s t-test for paired samples (the mRNA polysome fraction was paired to its corresponding total mRNA in each independent experiment). P-value: *(P < 0.05), **(P < 0.01), ***(P < 0.001), **** (P < 0.0001)
Fig. 6
Fig. 6
Loss of FABP7 in hESCs reduces their neural differentiation potential. a qPCR analysis in FABP7 and VIM KD H9 hESCs. Graph (relative expression to NT shRNA H9 hESCs) represents the mean ± s.e.m. of two independent experiments with three biological replicates. b Knockdown of FABP7 slows down neural differentiation. Percentage of OCT4 and PAX6-positive cells/total nuclei at different days after neural induction of H9 hESCs (mean ± s.e.m. (n = 3, 400–650 total cells per data point). c After 10 days of neural induction, cells were assessed by immunofluorescence with OCT4, PAX6, and Hoechst staining. Scale bar represents 20 μm. d Quantification of the percentage of PAX6-positive cells/total nuclei after 10 days of neural induction. Graph represents the mean ± s.e.m. of 3 independent experiments, 3000 total cells per experiment. e qPCR analysis after 10 days of neural induction. Graph (relative expression to NT shRNA cells) represents the mean ± s.e.m. of three independent experiments. f qPCR analysis after 3 weeks of neuronal induction. Data (relative expression to NT shRNA cells) represent the mean ± s.e.m. of three independent experiments with three biological replicates. g After 3 weeks of neuronal induction, cells were assessed by immunofluorescence with MAP2, GFAP, and Hoechst staining. Scale bar represents 20 μm. All the statistical comparisons were made by Student’s t-test for unpaired samples. P-value: *(P < 0.05), **(P < 0.01), ***(P < 0.001), **** (P < 0.0001)
Fig. 7
Fig. 7
Ectopic expression of CSDE1 reduces FABP7 levels and impairs neural differentiation. a qPCR analysis of FABP7 and VIM levels (relative expression to EV H9 hESCs) in CSDE1-overexpressing (CSDE1 OE) H9 hESCs. Data represent two independent experiments with three biological replicates. b Western blot analysis of H9 hESCs with antibodies to CSDE1, FABP7 and VIM. β-actin is the loading control. c After 10 days of neural induction, cells were assessed by immunofluorescence with OCT4, PAX6, and Hoechst staining. Scale bar represents 20 μm. d Quantification of the percentage of PAX6-positive cells/total nuclei after 10 days of neural induction. Graph represents the mean ± s.e.m. of three independent experiments, 1000–1400 total cells per experiment. e Western blot analysis of H9 hESCs and their differentiated counterparts after 10 days of neural induction. f qPCR analysis after 10 days of neural induction. Data (relative expression to EV shRNA cells) represent three independent experiments with three biological replicates. All the statistical comparisons were made by Student’s t-test for unpaired samples. P-value: *(P < 0.05), **(P < 0.01), ***(P < 0.001), ****(P < 0.0001)
Fig. 8
Fig. 8
CSDE1 downregulation changes the hESC transcriptome to a neural differentiation-prone state. a Schematic representation of the methodology underlying CSDE1 binding motif-based searches in differentially expressed transcripts on CSDE1 KD. Venn diagram represents the number of unique transcripts shared between differentially expressed genes from CSDE1 KD H9 hESCs and predicted CSDE1 targets. Transcripts showing a log2-fold change at a False Discovery Rate (FDR) < 0.05 were retained as significantly differentially expressed. b Heatmap depicting the log2-fold change of the differentially expressed transcripts (FDR < 0.05) with at least one CSDE1 binding site identified in CSDE1 KD hESCs by RNA-sequencing analysis. c Bar graph representing the top gene ontologies (Biological Processes) of the differentially expressed transcripts with predicted CSDE1 motif in CSDE1 KD hESCs. d Heatmap representing a subset of candidate differentially expressed genes from RNA-sequencing analysis
Fig. 9
Fig. 9
CSDE1 regulates the steady-state mRNA levels of neural factors in multiple pluripotent cell lines. ad qPCR analysis of distinct CSDE1 KD hESC and iPSC lines daily monitored to remove differentiated cells. Graphs (relative expression to non-targeting (NT) shRNA) represent the mean ± s.e.m. a H9 hESCs, n = twelve biological replicates from five independent experiments; b H1 hESCs, n = six biological replicates from two independent experiments; c HUES9 hESCs, n = nine biological replicates from two independent experiments; d iPSCs, n = six biological replicates from two independent experiments. e qPCR analysis of CSDE1 −/− H9 hESCs daily monitored to remove differentiated cells. Graph (relative expression to wild-type H9 hESCs) represents the mean ± s.e.m of six biological replicates from two independent experiments. f qPCR analysis (relative expression to EV H9 hESCs) in CSDE1 OE hESCs. Data represent two independent experiments with three biological replicates. KD = CSDE1 knockdown. KO = CSDE1 knockout. OE = CSDE1 overexpression. All the statistical comparisons were made by Student’s t-test for unpaired samples. P-value: *(P < 0.05), **(P < 0.01), ***(P < 0.001), **** (P < 0.0001)
Fig. 10
Fig. 10
CSDE1 binds mRNAs involved in neurogenesis and post-transcriptionally regulates their steady-state levels. a RIP with CSDE1 antibody. Quantitative PCR analysis of the indicated genes is expressed as fold enrichment over RIP performed with FLAG control antibody. Graph (relative enrichment to FLAG antibody) represents the mean ± s.e.m. (n = 4 independent experiments). b Western blot analysis of H9 hESCs with antibody to SEMA4A. GAPDH is the loading control. c mRNA levels were determined after the indicated time of actinomycin D (ActD) treatment (5 μg ml1) by qPCR. For each gene, the right graph corresponds to a representative experiment showing the percentage of mRNA relative to time = 0. In the left panel, mRNA degradation is shown as relative slope to non-targeting shRNA hESCs (mean ± s.e.m. of four independent experiments). d Polysome profiling experiments followed by qPCR analysis. Total and polysome fractions mRNA levels are expressed as relative values to total and polysome fractions of NT shRNA hESCs, respectively. Graph represents the mean ± s.e.m. (n = 4 independent experiments). No further changes in SEMA4A, EPHB3, CDH2, and FZD7 were observed in polysome fractions compared with total cell extracts. In a and c the statistical comparisons were made by Student’s t-test for unpaired samples. In d the statistical comparisons were made by Student’s t-test for paired samples (the mRNA polysome fraction was paired to its corresponding total mRNA in each independent experiment). P-value: *(P < 0.05), **(P < 0.01), ***(P < 0.001), **** (P < 0.0001)

Similar articles

Cited by

References

    1. Aguilo F, et al. Coordination of m(6)A mRNA methylation and gene transcription by ZFP217 regulates pluripotency and reprogramming. Cell Stem Cell. 2015;17:689–704. doi: 10.1016/j.stem.2015.09.005. - DOI - PMC - PubMed
    1. Ye J, Blelloch R. Regulation of pluripotency by RNA binding proteins. Cell Stem Cell. 2014;15:271–280. doi: 10.1016/j.stem.2014.08.010. - DOI - PMC - PubMed
    1. You KT, Park J, Kim VN. Role of the small subunit processome in the maintenance of pluripotent stem cells. Genes Dev. 2015;29:2004–2009. doi: 10.1101/gad.267112.115. - DOI - PMC - PubMed
    1. Gerstberger S, Hafner M, Tuschl T. A census of human RNA-binding proteins. Nat. Rev. Genet. 2014;15:829–845. doi: 10.1038/nrg3813. - DOI - PMC - PubMed
    1. Kwon SC, et al. The RNA-binding protein repertoire of embryonic stem cells. Nat. Struct. Mol. Biol. 2013;20:1122–1130. doi: 10.1038/nsmb.2638. - DOI - PubMed

Publication types

MeSH terms