. 2017 Nov 13;8(1):1441.
doi: 10.1038/s41467-017-01530-3.

Mapping functional diversity from remotely sensed morphological and physiological forest traits

Affiliations

Mapping functional diversity from remotely sensed morphological and physiological forest traits

Fabian D Schneider et al. Nat Commun. .

Abstract

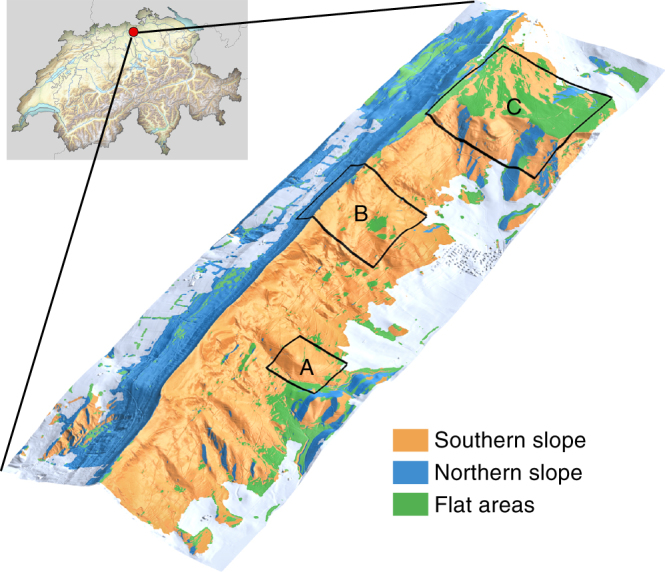
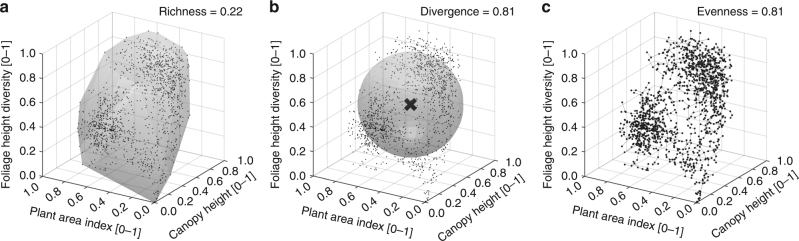
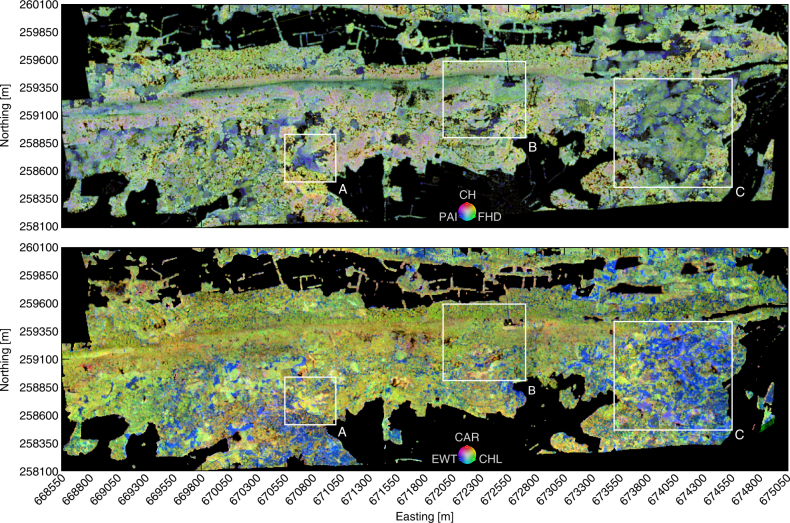
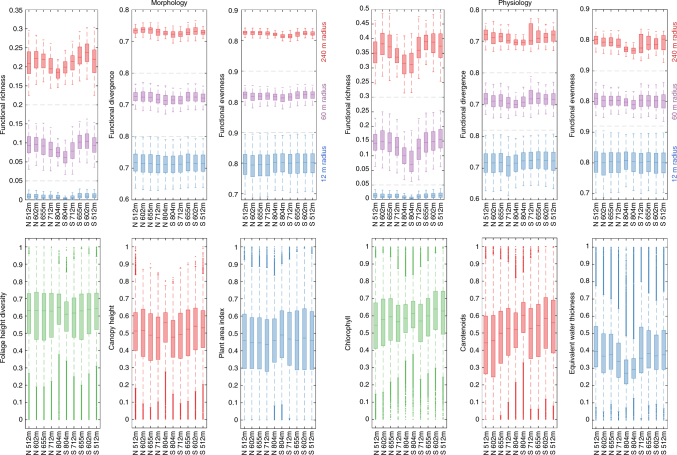
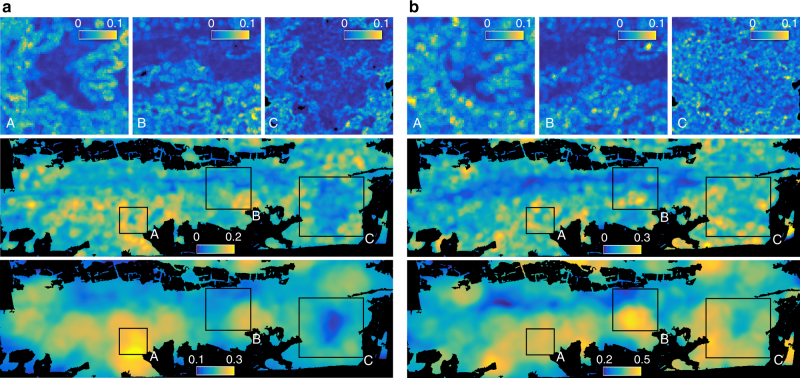
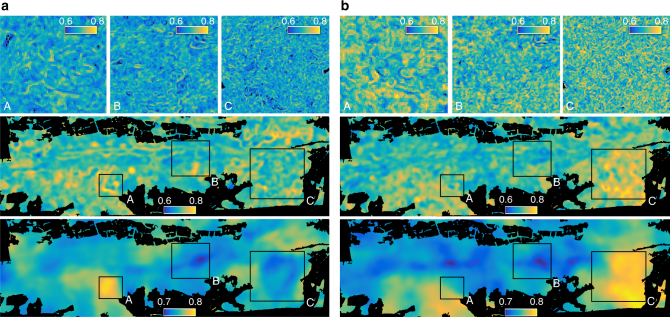
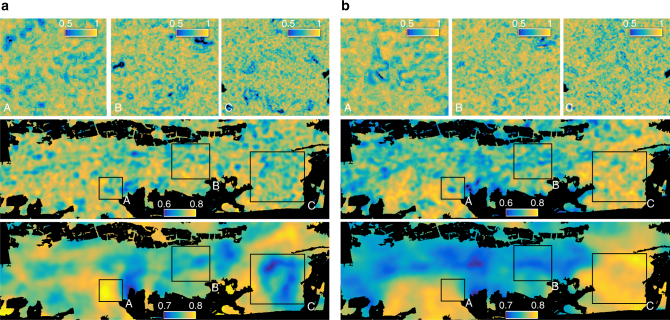
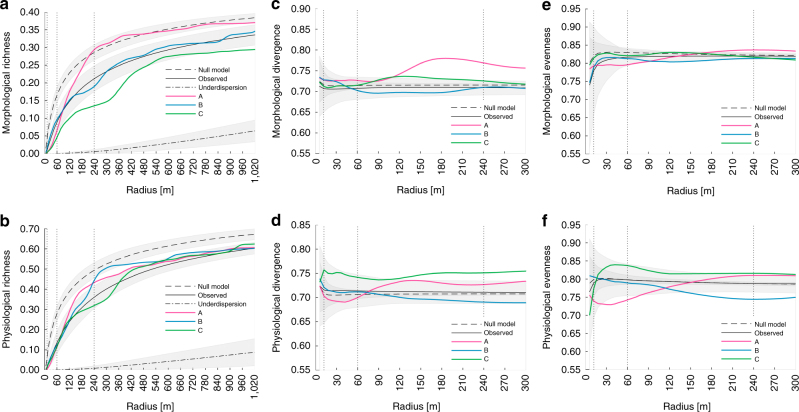
Assessing functional diversity from space can help predict productivity and stability of forest ecosystems at global scale using biodiversity-ecosystem functioning relationships. We present a new spatially continuous method to map regional patterns of tree functional diversity using combined laser scanning and imaging spectroscopy. The method does not require prior taxonomic information and integrates variation in plant functional traits between and within plant species. We compare our method with leaf-level field measurements and species-level plot inventory data and find reasonable agreement. Morphological and physiological diversity show consistent change with topography and soil, with low functional richness at a mountain ridge under specific environmental conditions. Overall, functional richness follows a logarithmic increase with area, whereas divergence and evenness are scale invariant. By mapping diversity at scales of individual trees to whole communities we demonstrate the potential of assessing functional diversity from space, providing a pathway only limited by technological advances and not by methodology.


Conflict of interest statement

The authors declare no competing financial interests.

Figures

Fig. 1
Fig. 1
Laegern mountain temperate mixed forest site in Switzerland. The test site is located near Zurich and covers about 2 × 6 km. The mountain range is divided by a ridge running from east to west, separating the forested area in north facing (blue) and south facing (orange) slopes. Flat areas are defined with a slope <10° (green). Areas not covered by forest (agriculture, grassland, urban areas) are shown in grey
Fig. 2
Fig. 2
Three aspects of functional diversity based on morphological forest traits of a circular area with a radius of 120 m. The three traits are foliage height diversity, plant area index and canopy height in relative units from 0 to 1. a The shaded volume is functional richness, b the distance from the surface of the shaded sphere is functional divergence and c the variation of segment length in the minimum spanning tree is functional evenness
Fig. 3
Fig. 3
Spatial composition of morphological and physiological forest traits. RGB colour composites of morphological traits (upper panel) plotted as abundance-scaled plant area index (PAI, blue), canopy height (CH, red) and foliage height diversity (FHD, green), and physiological traits (lower panel) plotted as abundance-scaled equivalent water thickness (EWT, blue), carotenoids (CAR, red) and chlorophyll (CHL, green)
Fig. 4
Fig. 4
Boxplots of functional diversity indices and traits grouped by altitudinal belts. Functional richness, divergence and evenness (top panel) are shown for three spatial scales at 12 m (blue), 60 m (purple) and 240 m (red) radius. Underlying functional trait values are displayed below, with morphological traits on the left and physiological traits on the right side. Boxes show the median and ±1 standard deviation and whiskers mark ±2 standard deviations. Altitude values on the x-axis of the boxplots indicate the middle of the altitudinal belt for the north (N) and the south (S) side of the mountain ridge
Fig. 5
Fig. 5
Spatial patterns of morphological and physiological richness at three different scales. Functional richness was computed at 12 m (top), 60 m (middle) and 240 m (bottom) radius based on a morphological traits and b physiological traits. At 12 m radius (top panels), subregions A, B and C are plotted only. The colour is scaled from the lowest (dark blue) to the highest (yellow) richness value with a maximum possible range from 0 to 1
Fig. 6
Fig. 6
Spatial patterns of morphological and physiological divergence at three different scales. Functional divergence was computed at 12 m (top), 60 m (middle) and 240 m (bottom) radius based on a morphological traits and b physiological traits. At 12 m radius (top panels), subregions A, B and C are plotted only. The colour is scaled from the lowest (dark blue) to the highest (yellow) divergence value with a maximum possible range from 0 to 1
Fig. 7
Fig. 7
Spatial patterns of morphological and physiological evenness at three different scales. Functional evenness was computed at 12 m (top), 60 m (middle) and 240 m (bottom) radius based on a morphological traits and b physiological traits. At 12 m radius (top panels), subregions A, B and C are plotted only. The colour is scaled from the lowest (dark blue) to the highest (yellow) evenness value with a maximum possible range from 0 to 1
Fig. 8
Fig. 8
Scale dependency of the three functional diversity measures for morphological and physiological traits. Functional a, b richness, c, d divergence and e, f evenness are displayed as a function of radius (diversity–area) for a, c, e morphological and b, d, f physiological traits. Null model corresponds to randomly distributed traits as dashed line. Observed corresponds to remotely sensed data as solid line. Underdispersion assuming direct neighbours corresponds to dashed–dotted line. Curves A, B C are stemming from a single pixel in the centre of subregions as in Fig. 5. Vertical dotted lines correspond to radii as in Fig. 5

References

    1. Roscher C, et al. A functional trait-based approach to understand community assembly and diversity-productivity relationships over 7 years in experimental grasslands. Perspect. Plant Ecol., Evol. Syst. 2013;15:139–149. doi: 10.1016/j.ppees.2013.02.004. - DOI
    1. Mouillot D, Graham NA, Villéger S, Mason NW, Bellwood DR. A functional approach reveals community responses to disturbances. Trends Ecol. Evol. 2013;28:167–177. doi: 10.1016/j.tree.2012.10.004. - DOI - PubMed
    1. Calba S, Maris V, Devictor V. Measuring and explaining large-scale distribution of functional and phylogenetic diversity in birds: separating ecological drivers from methodological choices. Glob. Ecol. Biogeogr. 2014;23:669–678. doi: 10.1111/geb.12148. - DOI
    1. Fründ J, Dormann CF, Holzschuh A, Tscharntke T. Bee diversity effects on pollination depend on functional complementarity and niche shifts. Ecology. 2013;94:2042–2054. doi: 10.1890/12-1620.1. - DOI - PubMed
    1. Gotelli NJ, Colwell RK. Quantifying biodiversity: procedures and pitfalls in the measurement and comparison of species richness. Ecol. Lett. 2001;4:379–391. doi: 10.1046/j.1461-0248.2001.00230.x. - DOI

Publication types

LinkOut - more resources