. 2017 Aug;3(8):894-904.
doi: 10.1016/j.jacep.2016.12.017.

The Electrophysiological Substrate of Early Repolarization Syndrome: Noninvasive Mapping in Patients

Affiliations

The Electrophysiological Substrate of Early Repolarization Syndrome: Noninvasive Mapping in Patients

Junjie Zhang et al. JACC Clin Electrophysiol. 2017 Aug.

Abstract

Background: The early repolarization (ER) pattern is a common ECG finding. Recent studies established a definitive clinical association between ER and fatal ventricular arrhythmias. However, the arrhythmogenic substrate of ER in the intact human heart has not been characterized.

Objectives: To map the epicardial electrophysiological (EP) substrate in ER syndrome patients using noninvasive Electrocardiographic Imaging (ECGI), and to characterize substrate properties that support arrhythmogenicity.

Methods: Twenty-nine ER syndrome patients were enrolled, 17 of which had a malignant syndrome. Characteristics of the abnormal EP substrate were analyzed using data recorded during sinus rhythm. The EP mapping data were analyzed for electrogram morphology, conduction and repolarization. Seven normal subjects provided control data.

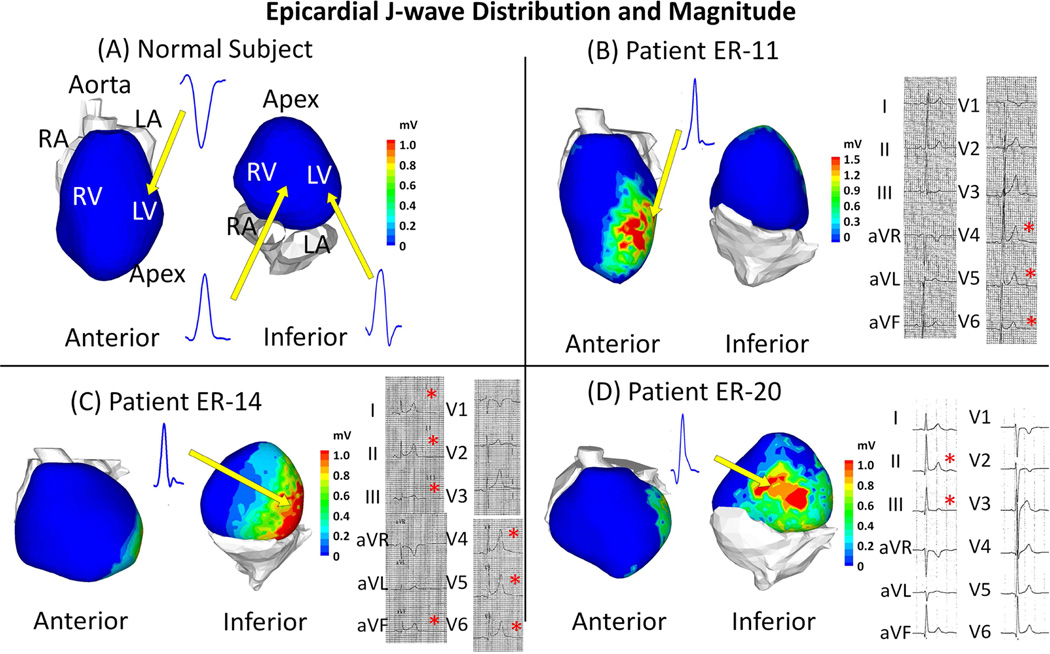
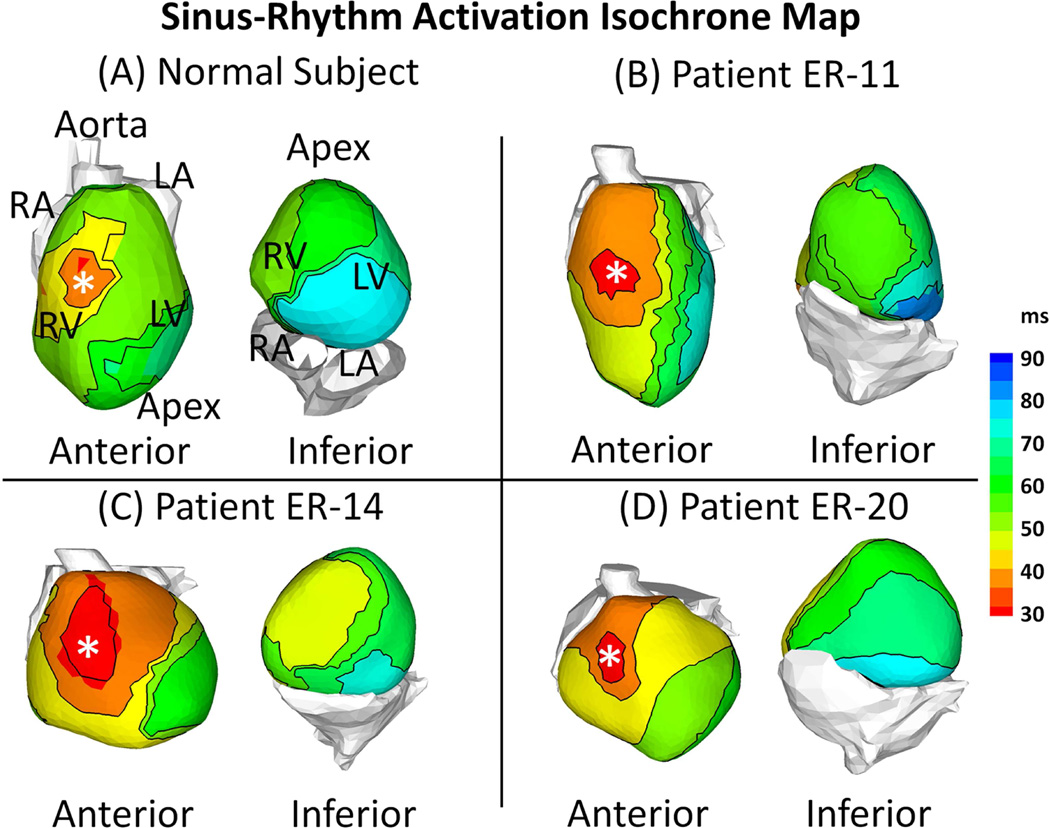
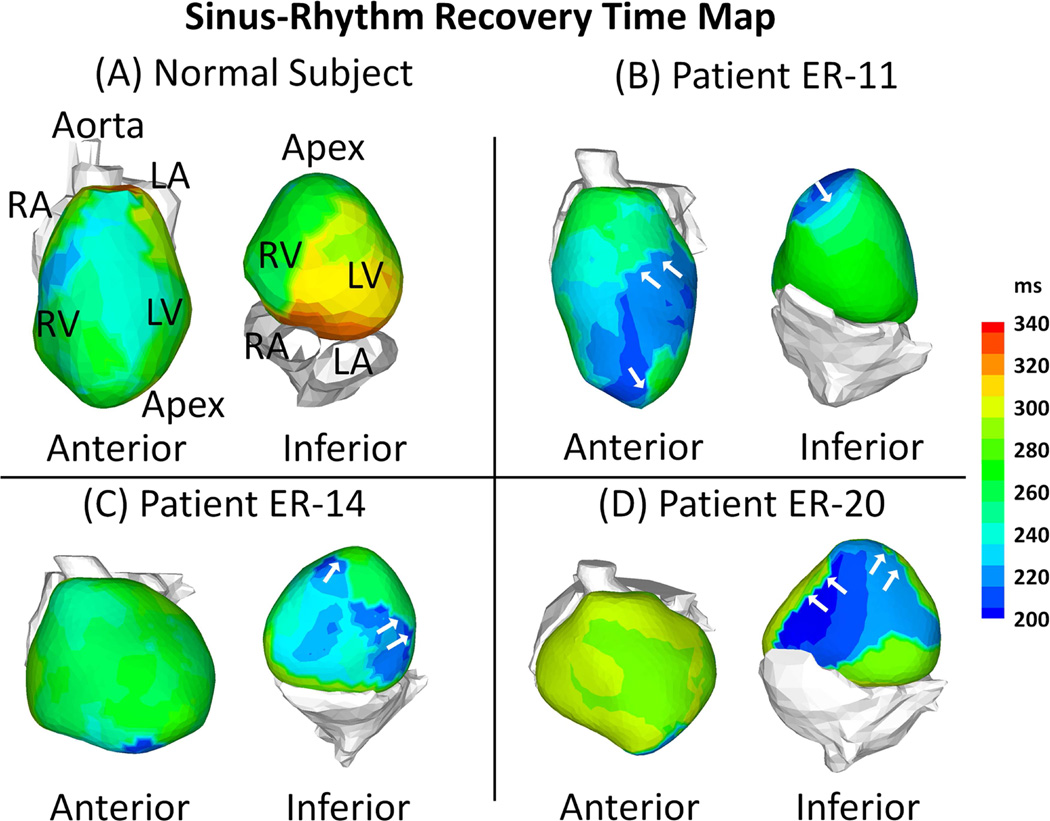
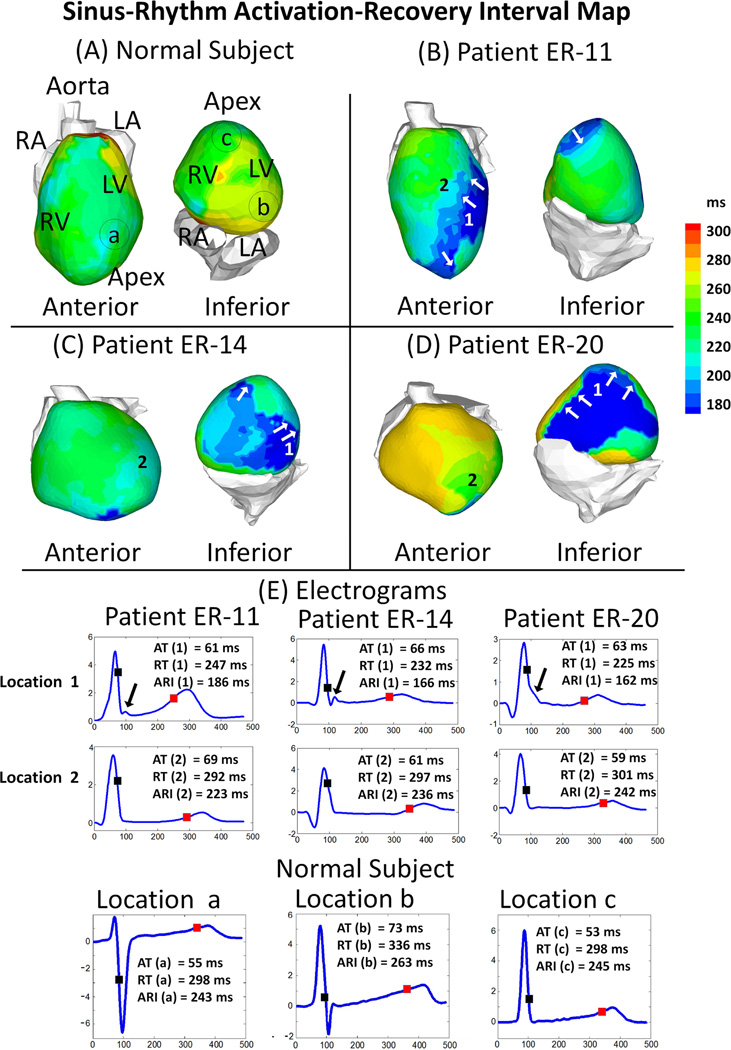
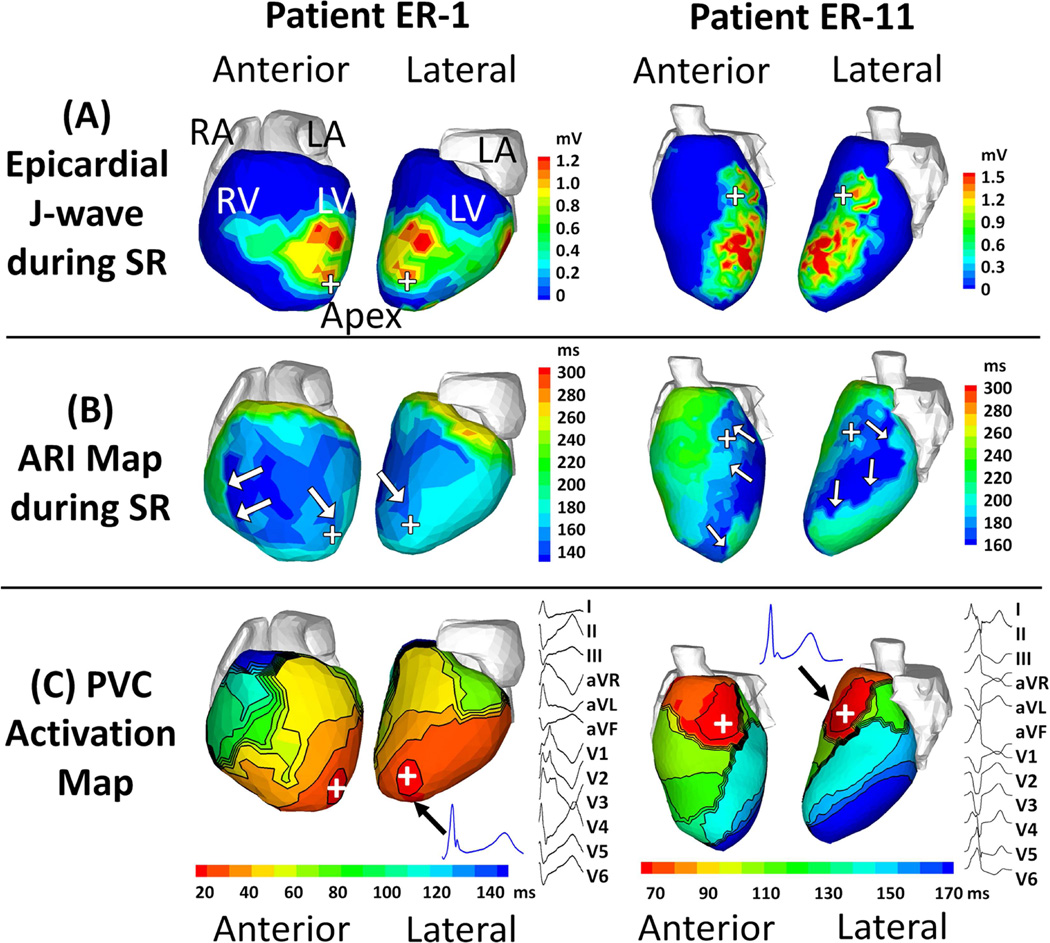
Results: The abnormal EP substrate in ER syndrome patients has the following properties: (1) Abnormal epicardial electrograms characterized by presence of J-waves in localized regions; (2) Absence of conduction abnormalities, including delayed activation, conduction block, or fractionated electrograms; (3) Marked abbreviation of ventricular repolarization in areas with J-waves. The action potential duration (APD) was significantly shorter than normal (196±19 vs. 235±21 ms, p<0.05). Shortening of APD occurred heterogeneously, leading to steep repolarization gradients compared to normal control (45±17 vs.7±5 ms/cm, p<0.05). Premature ventricular contractions (PVCs) were recorded in 2 patients. The PVC sites of origin were closely related to the abnormal EP substrate with J-waves and steep repolarization gradients.

Conclusions: Early Repolarization is associated with steep repolarization gradients caused by localized shortening of APD. Results suggest association of PVC initiation sites with areas of repolarization abnormalities. Conduction abnormalities were not observed.

Keywords: early repolarization; idiopathic ventricular fibrillation; mapping; sudden cardiac death.


Figures

Figure 1
Figure 1. Epicardial J-wave Distribution and Magnitude
Abnormal epicardial EGMs with a J-wave that resemble the ER pattern (terminal-QRS notch or slurring) on the surface ECG are observed in ERS patients, but not seen in normal subjects. Example maps of epicardial J-wave magnitude in 3 ERS patients are shown. The maps are shown in anterior view and inferior view for each subject. The locations of epicardial J-waves are ER-11: lateral and apical left ventricle (LV); ER-14: lateral and inferior LV; ER-20: lateral and inferior LV. Inset: representative EGMs with a J-wave (QRS only) in ERS patients (Panels B, C, D) and EGMs from corresponding locations in the normal control subject (Panel A). 12-lead ECGs for ERS patients are shown to the right of the epicardial maps. A red asterisk indicates the presence of early repolarization pattern. LA = left atrium; LV = left ventricle; RA = right ventricle; RV = right ventricle.
Figure 2
Figure 2. Activation Isochrone Maps
Examples of activation during sinus rhythm (SR) are shown for a normal control subject and 3 ERS patients. The maps are shown in anterior view and inferior view for each subject. ERS patients and the normal subject have similar activation patterns. After breakthrough in the anterior right ventricle (asterisk), the wavefront propagates uniformly to activate both ventricles. The LV base is the latest region to activate. Conduction block and slow conduction were not observed in the ERS patients.
Figure 3
Figure 3. Recovery Time (RT) Maps
Examples of epicardial RT during SR are shown for a normal control subject and 3 ERS patients. Maps are shown in anterior view and inferior view for each subject. ERS patients have regions with abnormally short RT (dark blue). White arrows in Panels B-C point to regions with steep RT gradients.
Figure 4
Figure 4. Activation-recovery Interval (ARI) Maps
Panels A to D: ARI maps for a normal control subject and 3 ERS patients. Maps are shown in anterior view and inferior view for each subject. ERS patients have regions with abnormally short ARI (dark blue). White arrows in Panels B-C point to regions with steep ARI gradients. Top two rows of Panel E show ECGI reconstructed electrograms (EGMs) from two adjacent location in each ERS patient. Location 1 (top row): prominent J-wave and short ARI; location 2 (middle row): absence of J-wave and normal ARI. There is a steep gradient of repolarization across these two locations. Bottom row of Panel E shows 3 EGMs from the normal subject, from locations marked in Panel A. The time instances of activation (AT; black square), recovery (RT; red square) and corresponding ARIs are indicated.
Figure 5
Figure 5. The electrophysiological substrate in relation to premature ventricular contractions (PVCs)
(A) Epicardial J-wave magnitude and (B) Activation-recovery interval (ARI) maps during sinus rhythm (SR). (C) PVC activation map and 12-lead ECG. Each panel shows maps for 2 patients, ER-1 (left, PVC coupling interval =635 ms) and ER-11 (right, PVC coupling interval = 520 ms). The hearts are displayed in anterior and lateral views. White arrows in Panels B point to regions with steep ARI gradients. In panel C, J-wave electrograms (EGMs) from the PVC site of origin are shown (black arrow); 12-lead ECG depicting the PVC is shown to the right of the map. The PVC initiation sites are indicated by plus signs “+”. Note that an EP substrate with abnormal EGMs, shortened ARIs and steep ARI gradients correlated with the PVC site of origin in both cases.

References

    1. Haissaguerre M, Derval N, Sacher F, et al. Sudden cardiac arrest associated with early repolarization. N Engl J Med. 2008;358:2016–2023. - PubMed
    1. Tikkanen JT, Anttonen O, Junttila J, et al. Long-term outcome associated with early repolarization on electrocardiography. N Engl J Med. 2009;361:2529–2537. - PubMed
    1. Kambara H, Phillips J. Long-term evaluation of early repolarization syndrome (normal variant rst segment elevation) Am J Cardiol. 1976;38:157–161. - PubMed
    1. Gussak I, Antzelevitch C. Early repolarization syndrome: Clinical characteristics and possible cellular and ionic mechanisms. J Electrocardiol. 2000;33:299–309. - PubMed
    1. Boineau JP. The early repolarization variant--normal or a marker of heart disease in certain subjects. J Electrocardiol. 2007;40:3, e11–e16. - PubMed

Publication types