

Patterns of mortality by occupation in the UK, 1991-2011: a comparative analysis of linked census and mortality records
- PMID: 29130073
- PMCID: PMC5666203
- DOI: 10.1016/S2468-2667(17)30193-7
Patterns of mortality by occupation in the UK, 1991-2011: a comparative analysis of linked census and mortality records
Abstract
Background: Detailed assessments of mortality by occupation are scarce. We aimed to assess mortality by occupation in the UK, differences in rates between England and Wales and Scotland, and changes over time in Scotland.
Methods: We analysed adults of working age (20-59 years) using linked census and death records. Main occupation was coded into more than 60 groups in the 2001 census, with mortality follow-up until Dec 31, 2011. Comparable occupation data were available for Scotland in 1991, allowing assessment of trends over time. We calculated age-standardised all-cause mortality rates (per 100 000 person-years), stratified by sex. We used Monte Carlo simulation to derive p values and 95% CIs for the difference in mortality over time and between England and Wales and Scotland.
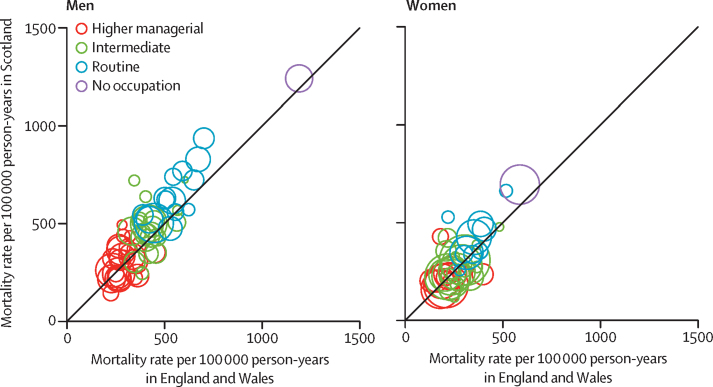
Findings: During 4·51 million person-years of follow-up, mortality rates by occupation differed by more than three times between the lowest and highest observed rates in both men and women. Among men in England and Wales, health professionals had the lowest mortality (225 deaths per 100 000 person-years [95% CI 145-304]), with low rates also shown in managers and teachers. The highest mortality rates were in elementary construction (701 deaths per 100 000 person-years [95% CI 593-809]), and housekeeping and factory workers. Among women, teachers and business professionals had low mortality, and factory workers and garment trade workers had high rates. Mortality rates have generally fallen, but have stagnated or even increased among women in some occupations, such as cleaners (337 deaths per 100 000 person years [95% CI 292-382] in 1991, rising to 426 deaths per 100 000 person years in 2001 [371-481]). Findings from simulation models suggested that if mortality rates by occupation in England and Wales applied to Scotland, 631 fewer men (95% CI 285-979; a 9·7% decrease) and 273 fewer women (26-513; 6·7% decrease) of working age would die in Scotland every year. Excess deaths in Scotland were concentrated among lower skilled occupations (eg, female cleaners).
Interpretation: Mortality rates differ greatly by occupation. The excess mortality in Scotland is concentrated among low-skilled workers and, although mortality has improved in men and women in most occupational groups, some groups have experienced increased rates. Future research investigating the specific causes of death at the detailed occupational level will be valuable, particularly with a view to understanding the health implications of precarious employment and the need to improve working conditions in very specific occupational groups.
Funding: None.
Figures
Comment in
-
Mortality by occupation: the best basis for actionable results?Lancet Public Health. 2017 Nov;2(11):e486-e487. doi: 10.1016/S2468-2667(17)30196-2. Epub 2017 Oct 23. Lancet Public Health. 2017. PMID: 29253370 No abstract available.
References
-
- Hunter D. The diseases of occupations. 5th edn. The English Universities Press; London: 1974.
-
- Office of Population Censuses and Surveys . The Registrar General's decennial supplement for England and Wales, 1970–1972. HM Stationery Office; London: 1978.
Grants and funding
LinkOut - more resources
Full Text Sources
Other Literature Sources
Research Materials
