

Quantification of GABA, glutamate and glutamine in a single measurement at 3 T using GABA-edited MEGA-PRESS
- PMID: 29130590
- PMCID: PMC5765428
- DOI: 10.1002/nbm.3847
Quantification of GABA, glutamate and glutamine in a single measurement at 3 T using GABA-edited MEGA-PRESS
Abstract
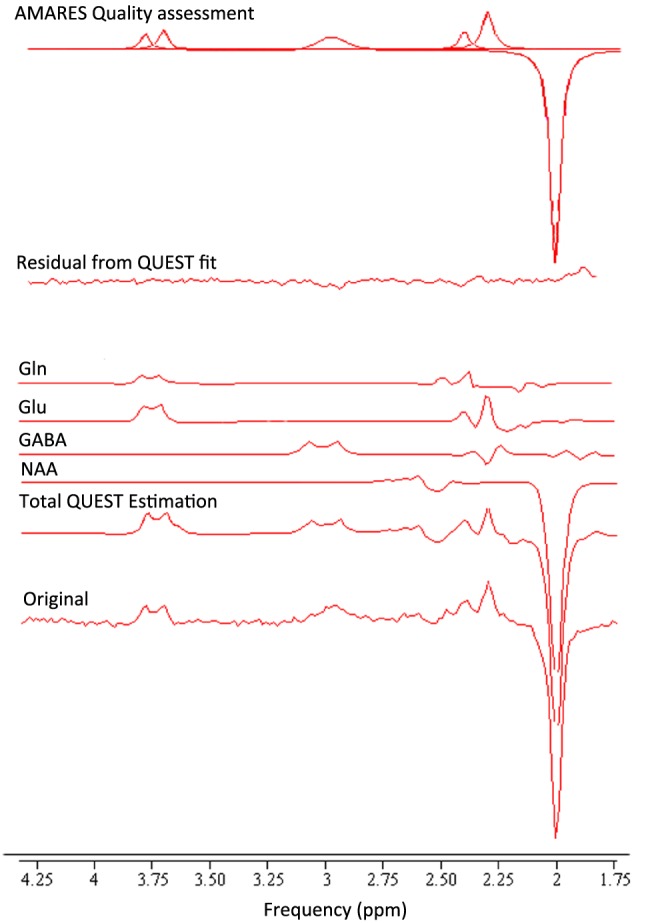
γ-Aminobutyric acid (GABA) and glutamate (Glu), major neurotransmitters in the brain, are recycled through glutamine (Gln). All three metabolites can be measured by magnetic resonance spectroscopy in vivo, although GABA measurement at 3 T requires an extra editing acquisition, such as Mescher-Garwood point-resolved spectroscopy (MEGA-PRESS). In a GABA-edited MEGA-PRESS spectrum, Glu and Gln co-edit with GABA, providing the possibility to measure all three in one acquisition. In this study, we investigated the reliability of the composite Glu + Gln (Glx) peak estimation and the possibility of Glu and Gln separation in GABA-edited MEGA-PRESS spectra. The data acquired in vivo were used to develop a quality assessment framework which identified MEGA-PRESS spectra in which Glu and Gln could be estimated reliably. Phantoms containing Glu, Gln, GABA and N-acetylaspartate (NAA) at different concentrations were scanned using GABA-edited MEGA-PRESS at 3 T. Fifty-six sets of spectra in five brain regions were acquired from 36 healthy volunteers. Based on the Glu/Gln ratio, data were classified as either within or outside the physiological range. A peak-by-peak quality assessment was performed on all data to investigate whether quality metrics can discriminate between these two classes of spectra. The quality metrics were as follows: the GABA signal-to-noise ratio, the NAA linewidth and the Glx Cramer-Rao lower bound (CRLB). The Glu and Gln concentrations were estimated with precision across all phantoms with a linear relationship between the measured and true concentrations: R1 = 0.95 for Glu and R1 = 0.91 for Gln. A quality assessment framework was set based on the criteria necessary for a good GABA-edited MEGA-PRESS spectrum. Simultaneous criteria of NAA linewidth <8 Hz and Glx CRLB <16% were defined as optimum features for reliable Glu and Gln quantification. Glu and Gln can be reliably quantified from GABA-edited MEGA-PRESS acquisitions. However, this reliability should be controlled using the quality assessment methods suggested in this work.
Keywords: GABA; MEGA-PRESS; glutamate; glutamine; quantification.
© 2017 The Authors. NMR in Biomedicine published by John Wiley & Sons Ltd.
Figures


References
-
- Coyle JT. The GABA–glutamate connection in schizophrenia: which is the proximate cause? Biochem Pharmacol. 2004;68:1507‐1514. - PubMed
-
- Simister RJ, McLean MA, Barker GJ, Duncan JS. Proton magnetic resonance spectroscopy of malformations of cortical development causing epilepsy. Epilepsy Res. 2007;74:107‐115. - PubMed
-
- Harada M, Taki MM, Nose A, et al. Non‐invasive evaluation of the GABAergic/glutamatergic system in autistic patients observed by MEGA‐editing proton MR spectroscopy using a clinical 3 Tesla instrument. J Autism Dev Disord. 2011;41:447‐454. - PubMed
MeSH terms
Substances
Grants and funding
LinkOut - more resources
Full Text Sources
Other Literature Sources
Medical
