

Self-reported difficulty and preferences of wheeled mobility device users for simulated low-floor bus boarding, interior circulation and disembarking
- PMID: 29130752
- PMCID: PMC7206450
- DOI: 10.1080/17483107.2017.1401128
Self-reported difficulty and preferences of wheeled mobility device users for simulated low-floor bus boarding, interior circulation and disembarking
Abstract
Background: Low ridership of public transit buses among wheeled mobility device users suggests the need to identify vehicle design conditions that are either particularly accommodating or challenging. The objective of this study was to determine the effects of low-floor bus interior seating configuration and passenger load on wheeled mobility device user-reported difficulty, overall acceptability and design preference.
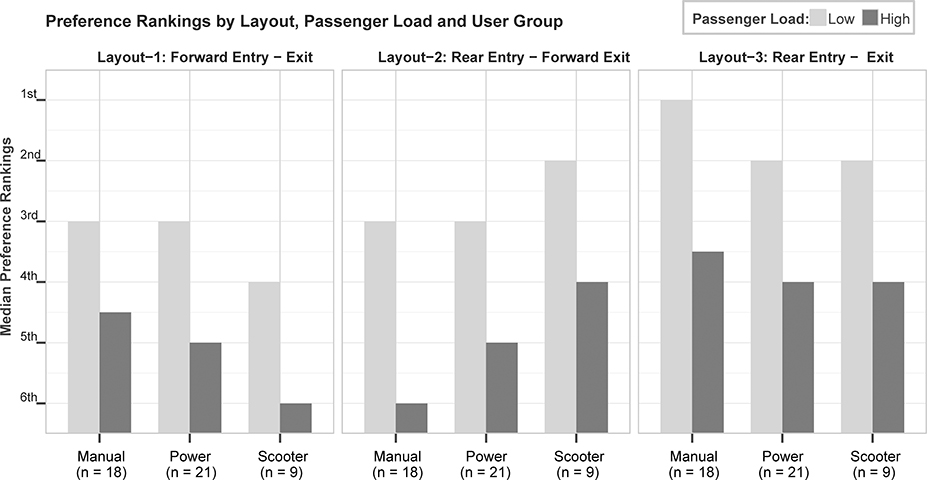
Methods: Forty-eight wheeled mobility users evaluated three interior design layouts at two levels of passenger load (high vs. low) after simulating boarding and disembarking tasks on a static full-scale low-floor bus mockup.
Results: User self-reports of task difficulty, acceptability and design preference were analyzed across the different test conditions. Ramp ascent was the most difficult task for manual wheelchair users relative to other tasks. The most difficult tasks for users of power wheelchairs and scooters were related to interior circulation, including moving to the securement area, entry and positioning in the securement area and exiting the securement area. Boarding and disembarking at the rear doorway was significantly more acceptable and preferred compared to the layouts with front doorways.
Conclusion: Understanding transit usability barriers, perceptions and preferences among wheeled mobility users is an important consideration for clinicians who recommend mobility-related device interventions to those who use public transportation. Implications for Rehabilitation In order to maximize community participation opportunities for wheeled mobility users, clinicians should consider potential public transit barriers during the processes of wheelchair device selection and skills training. Usability barriers experienced by wheeled mobility device users on transit vehicles differ by mobility device type and vehicle configurations. Full-scale environment simulations are an effective means of identifying usability barriers and design needs in people with mobility impairments and may provide an alternative model for determining readiness for using fixed route buses or eligibility for paratransit.
Keywords: Wheelchairs; accessibility; low-floor bus; public transportation; usability.
Conflict of interest statement
Declaration of Interest
The authors report no potential conflicts of interest.
Figures


Similar articles
-
Wheeled Mobility Use on Accessible Fixed-Route Transit: A Field Study in Environmental Docility.Int J Environ Res Public Health. 2021 Mar 10;18(6):2840. doi: 10.3390/ijerph18062840. Int J Environ Res Public Health. 2021. PMID: 33802242 Free PMC article.
-
Effects of transit bus interior configuration on performance of wheeled mobility users during simulated boarding and disembarking.Appl Ergon. 2017 Jul;62:94-106. doi: 10.1016/j.apergo.2017.02.008. Epub 2017 Feb 27. Appl Ergon. 2017. PMID: 28411744
-
Low-floor bus design preferences of walking aid users during simulated boarding and alighting.Work. 2012;41 Suppl 1:4951-6. doi: 10.3233/WOR-2012-0791-4951. Work. 2012. PMID: 22317485
-
A systematic review of public transport accessibility for people using mobility devices.Disabil Rehabil. 2021 Aug;43(16):2253-2267. doi: 10.1080/09638288.2019.1697382. Epub 2019 Dec 4. Disabil Rehabil. 2021. PMID: 31800337
-
Disabled-by-design: effects of inaccessible urban public spaces on users of mobility assistive devices - a systematic review.Disabil Rehabil Assist Technol. 2024 Apr;19(3):604-622. doi: 10.1080/17483107.2022.2111723. Epub 2022 Aug 19. Disabil Rehabil Assist Technol. 2024. PMID: 35984675
Cited by
-
Experimental Study on Longitudinal Acceleration of Urban Buses and Coaches in Different Road Maneuvers.Sensors (Basel). 2023 Mar 15;23(6):3125. doi: 10.3390/s23063125. Sensors (Basel). 2023. PMID: 36991836 Free PMC article.
-
Accessible Design of Low-Speed Automated Shuttles: A Brief Review of Lessons Learned from Public Transit.Proc Hum Factors Ergon Soc Annu Meet. 2019;63(1):526-530. Proc Hum Factors Ergon Soc Annu Meet. 2019. PMID: 33762808 Free PMC article.
-
Effect of Passenger Encumbrance and Mobility Aid Use on Dwell Time Variability in Low-floor Transit Vehicles.Transp Res Part A Policy Pract. 2020 Feb;132:872-881. doi: 10.1016/j.tra.2020.01.002. Transp Res Part A Policy Pract. 2020. PMID: 33762799 Free PMC article.
-
Community mobility and participation assessment of manual wheelchair users: a review of current techniques and challenges.Front Hum Neurosci. 2024 Jan 5;17:1331395. doi: 10.3389/fnhum.2023.1331395. eCollection 2023. Front Hum Neurosci. 2024. PMID: 38249574 Free PMC article. Review.
-
Wheeled Mobility Use on Accessible Fixed-Route Transit: A Field Study in Environmental Docility.Int J Environ Res Public Health. 2021 Mar 10;18(6):2840. doi: 10.3390/ijerph18062840. Int J Environ Res Public Health. 2021. PMID: 33802242 Free PMC article.
References
-
- NTD. Federal Transit Administration: National Transit Database Washington, D.C.: U.S. Department of Transportation; 2017. [updated February 22; cited 2017 May 1]. Available from: https://www.transit.dot.gov/ntd/ntd-data
-
- Cross D, editor Wheelchair Access: Improvements, Standards, and Challenges. APTA Bus & Paratransit Conference; 2006; Anaheim, CA: American Public Transportation Association.
-
- King RD. TCRP Report 41: New Designs and Operating Experiences with Low-Floor Buses: National Academy Press; 1998. Available from: http://onlinepubs.trb.org/onlinepubs/tcrp/tcrp_rpt_41-a.pdf
-
- Nelson/Nygaard Consulting Associates. Status Report on the Use of Wheelchairs and Other Mobility Devices on Public and Private Transportation In: Nelson/Nygaard Consulting Associates, editor. Washington, DC: Easter Seals Project ACTION; 2008.
-
- National Council on Disability. The Current State of Transportation for People with Disabilities in the United States. Washington, DC: National Council on Disability; 2005.
Publication types
MeSH terms
Grants and funding
LinkOut - more resources
Full Text Sources
Other Literature Sources
Medical