. 2017 Dec 1;127(12):4554-4568.
doi: 10.1172/JCI92914. Epub 2017 Nov 13.

Recurrent ubiquitin B silencing in gynecological cancers establishes dependence on ubiquitin C

Affiliations

Recurrent ubiquitin B silencing in gynecological cancers establishes dependence on ubiquitin C

Alexia T Kedves et al. J Clin Invest. .

Abstract

Transcriptional repression of ubiquitin B (UBB) is a cancer-subtype-specific alteration that occurs in a substantial population of patients with cancers of the female reproductive tract. UBB is 1 of 2 genes encoding for ubiquitin as a polyprotein consisting of multiple copies of ubiquitin monomers. Silencing of UBB reduces cellular UBB levels and results in an exquisite dependence on ubiquitin C (UBC), the second polyubiquitin gene. UBB is repressed in approximately 30% of high-grade serous ovarian cancer (HGSOC) patients and is a recurrent lesion in uterine carcinosarcoma and endometrial carcinoma. We identified ovarian tumor cell lines that retain UBB in a repressed state, used these cell lines to establish orthotopic ovarian tumors, and found that inducible expression of a UBC-targeting shRNA led to tumor regression, and substantial long-term survival benefit. Thus, we describe a recurrent cancer-specific lesion at the level of ubiquitin production. Moreover, these observations reveal the prognostic value of UBB repression and establish UBC as a promising therapeutic target for ovarian cancer patients with recurrent UBB silencing.

Keywords: Genetics; Oncology; Ubiquitin-proteosome system.


Conflict of interest statement

Conflict of interest: The authors have declared that no conflict of interest exists.

Figures

Figure 1
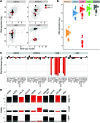
Figure 1. TCGA analysis identifies UBB silencing in HGSOC.
(A) Expression of the 4 human genes that encode for ubiquitin — RPS27A (yellow), UBA52 (blue), UBB (red), and UBC (green) — along with GAPDH (gray), in 3 TCGA tumor types — lung (LUAD), ovarian (OV), and thyroid (THCA). RNASeq data are displayed as gene-level log2RSEM values. Each data point represents a patient-specific RNA level for the indicated gene, with violin plot profiles indicating the derived probability density of each population. (B) UBB expression and DNA methylation in subtypes previously established by TCGA is shown in the top and bottom panels, respectively. Subtypes defined based on transcriptional signatures are immunoreactive (I), mesechymal (M), differentiated (D), and proliferative (P). Methylation levels are reported as β values from 0 (no methylation) to 1.0 (full methylation). (C) Correlation plots and corresponding P values show subtype-specific methylation and expression of UBB (associated Pearson R2 and P values: immunoreactive = –0.66, 6.8 e–21; mesenchymal = –0.69, 2.5e–14; differentiated = –0.74, 1.6e–25; proliferative = –0.84, 2.3e–46). Colors by transcriptional subtype correspond to B.
Figure 2
Figure 2. UBB silencing in gynecological cancers is associated with poor outcomes in HGSOC.
(A) The frequency of decreased UBB expression is shown for each cancer type. The ratio of UBC/UBB mRNA, on a per-patient basis, was determined and the percentage of patients having a UBC/UBB ratio greater than 1.25 is referred to as the silencing rate. A color scheme is used to highlight tumor types with comparable rates of UBB silencing. (B) Analysis of UBB in HGSOC indicates a bimodal distribution of log2(UBB) expression levels based on a Gaussian mixture model, illustrated by kernel density estimates. Dark red color indicates samples within the lowest quartile of expression (dark red = log2[UBB] ≤ Q1, gray = log2[UBB] > Q1). (C) Kaplan-Meier survival curves of HGSOC patient survival stratified by the lowest quartile of UBB expression (dark red) demonstrates significantly poorer outcomes than the patients with higher UBB expression tumors (gray) (P = 0.0138).
Figure 3
Figure 3. Ubiquitin expression and synthetic lethality.
(A) Gene expression versus gene copy number is shown for each of the 4 ubiquitin-encoding genes across all 1,053 cell lines from the CCLE. Each dot represents a single cell line. Note that the range of y-axis values reflects an expression range specific for each gene. Cell lines highlighted in red and black were selected for subsequent studies to validate levels of ubiquitin expression. The x axis shows the number of gene copies per diploid genome. (B) Box plots of data from A directly comparing expression of ubiquitin genes. Expression is a unimodal distribution for all ubiquitin genes except for UBB, which exhibits a substantial outlier population. GAPDH is included as a control. (C) Selected cell lines were cultured and RNA was analyzed by RT-qPCR using ubiquitin-gene-specific primers and expression levels represented as log2 fold-change mRNA relative to OC316. Data bars are colored red or black corresponding to the scheme in A. Biological quadruplicates with mean ± SEM are shown. This study was repeated twice. (D) UBBLO cell lines (red) are sensitive to UBC knockdown. Cell lines were transfected with 5 nM siRNAs targeting PLK1 or UBC. Mock transfections performed without siRNA are shown and results from each cell line are normalized to 1.0 based on viability of cells treated with nontargeting siRNA (data not included). Dashed lines indicate 10% viability level. CellTiter-Glo was added 72 hours after transfection. Results shown were singlicates and this experiment was performed 3 times independently.
Figure 4
Figure 4. Time-dependent cell fate outcomes following UBC knockdown.
Cells were transfected with siRNAs for UBC and PLK1 and were imaged continuously in the presence of a fluorogenic caspase substrate. Representative images show cell morphology and induction of caspase-3/7 activity over a period of 2 days. Caspase activation results in cleavage of a dye precursor resulting in fluorescence and is seen in both UBBLO (OVCAR8) and UBBWT (OC316) cells after knockdown of PLK1. Fluorescence is seen following knockdown of UBC only in UBBLO cells. Scale bars: 50 μm. Original magnification, ×10. This study was done twice.
Figure 5
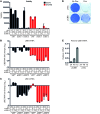
Figure 5. Low UBB expression is sufficient to establish dependency on UBC in diverse-lineage tumors.
(A) PLK1 and UBC siRNAs were serially diluted and transfected into UBBWT (black) and UBBLO (red) cells. Concentrations of target siRNA ranged from 0.16 to 20 nM and included a complementary amount of control nontargeting (NT) siRNA for a final total concentration of 20 nM. Dashed line denotes the 10% viability level (gray). This study was performed 3 times with each point in the siRNA dilution series as a singlicate. (B) Long-term viability in colony formation assays following transfection with siRNAs for PLK1, NT, and 2 independent siRNAs for UBC. After 14 days, cells were fixed and stained with crystal violet. Cell line names shown in red are UBBLO, black are UBBWT. The study was performed multiple times in different configurations. (C) Cell cycle analysis 30 hours after transfection of UBBWT and UBBLO cells with siRNAs against PLK1, UBC, NT, or no-siRNA controls. Distribution across the cell cycle is shown as percentage G1 (top) and G2 (bottom) with SD of biological replicates and repeated twice. Cell cycle data from UBBLO and UBBWT cells are shown as red and black bars, respectively. (D) A histogram of DNA content per cell is shown for OVCAR8 transfected with NT siRNA control (top) and UBC siRNA (bottom). This study was performed twice.
Figure 6
Figure 6. UBB and UBC are a synthetic lethal gene pair.
(A) OC316 (black, UBBWT) and OVCAR8 (red, UBBLO) cells were transfected with a combination of 2 siRNAs for each of UBB and UBC at 5 nM each as shown in the matrix below the figure. Individual siRNAs for UBC or UBB were combined with a nontargeting siRNA (NT) or with each other and viability (CellTiter-Glo assay) was determined 72 hours after transfection. The study was performed twice as biological quadruplicates and the results are shown as mean ± SEM. (B and C) Measurement of siRNA-mediated knockdown of mRNA for (B) UBB and (C) UBC as log2 fold-change relative to OC316 siNT control (far left sample) 24 hours after transfection among biological quadruplicates, with mean ± SEM and performed twice. (D) Colony formation assays of OVCAR8 containing a doxycycline-inducible (Dox-inducible) UBC shRNA transfected with a neomycin-resistance plasmid encoding UBB (pUBB) or the empty vector alone (pVec). Antibiotic-resistant cells were seeded into 6-well plates with or without Dox (100 ng/ml) and 7 days later cells were fixed and stained with crystal violet. This study was performed twice. (E) Expression from pUBB was measured on 3 successive days after addition of Dox. Analysis of technical replicates with SD of the mean was performed twice.
Figure 7
Figure 7. Knockdown of UBC in UBBLO cells causes a ubiquitin depletion catastrophe.
(A) Viability effects at 72 hours (left) in UBBWT (A2058, black) or UBBLO (HMCB, red) melanoma cells transduced with a doxycycline-inducible (Dox-inducible) shUBC hairpin and exposed to a dose titration of Dox. Studies were performed twice and analysis is replicates with SEM. Knockdown of UBC mRNA is shown at right (48 hours after Dox) and was performed twice with technical replicates and SEM. (B) HMCB (UBBLO) cells with shUBC or nontargeting hairpin control shNT were treated with 100 ng/ml Dox, and protein lysates were prepared at the time of Dox addition and at 12, 24, 36, and 48 hours thereafter. Antibodies used for Western blotting were against ubiquitin, γ-H2AX, c-myc, TP53, total H2AX, and β-actin. Molecular weight markers (kDa) are shown on the left. (C) Dox (100 ng/ml) was added to cells and lysates prepared at indicated times. Cycloheximide (CHX) was added (10 and 50 μg/ml) 6 hours prior to harvesting. Analysis of protein lysates following Dox time course was performed twice each with samples prepared from independent experiments.
Figure 8
Figure 8. In vivo validation of UBC synthetic lethality.
(A) Luciferized OVCAR8 cells were imaged by bioluminescence on days 9, 22, 29, 37, and 44 after implantation. On day 37 after implantation, half of the mice were transitioned to chow containing doxycycline (Dox). Representative images are shown and photon flux values are indicated in the colored value-range bar as photons/second/cm2/steradian (p/s/cm2/sr), which is a quantitative measure of tumor burden. (B) Pharmacodynamic study of UBC mRNA knockdown 36 hours after the shift to Dox chow. RNA was prepared from multiple tumor nodules from 2 mice per group, and UBC levels were normalized to NT control (no Dox). Error was calculated by SD of technical replicates and the study was done 3 times. (C) Total averaged bioluminescence for 10 mice per arm. Samples derived from shNT with Dox (closed circles) or without Dox (open circles) and shUBC mice with Dox (closed triangles) or without Dox (open triangles). SEM is shown for each time point. (D) Kaplan-Meier plot shows the percentage of mice surviving in each arm of study. All mice in the shNT arm succumb by day 60, and addition of Dox did not affect viability for shNT. Mice bearing tumors with shUBC (blue, red) had increased survival. Statistical significance indicated by P values as follows: not significant (N/S) = 0.61, ***P < 0.0002, ****P < 0.0001. Variation among the groups is substantially less than the difference between the shUBC+Dox and other groups. Tabulation for the survival curves is shown (Supplemental Table 3).

Comment in

References

    1. Pagliarini R, Shao W, Sellers WR. Oncogene addiction: pathways of therapeutic response, resistance, and road maps toward a cure. EMBO Rep. 2015;16(3):280–296. doi: 10.15252/embr.201439949. - DOI - PMC - PubMed
    1. McLornan DP, List A, Mufti GJ. Applying synthetic lethality for the selective targeting of cancer. N Engl J Med. 2014;371(18):1725–1735. doi: 10.1056/NEJMra1407390. - DOI - PubMed
    1. Bitler BG, et al. Synthetic lethality by targeting EZH2 methyltransferase activity in ARID1A-mutated cancers. Nat Med. 2015;21(3):231–238. - PMC - PubMed
    1. van den Bent MJ. Interobserver variation of the histopathological diagnosis in clinical trials on glioma: a clinician’s perspective. Acta Neuropathol. 2010;120(3):297–304. doi: 10.1007/s00401-010-0725-7. - DOI - PMC - PubMed
    1. Verhaak RG, et al. Integrated genomic analysis identifies clinically relevant subtypes of glioblastoma characterized by abnormalities in PDGFRA, IDH1, EGFR, and NF1. Cancer Cell. 2010;17(1):98–110. doi: 10.1016/j.ccr.2009.12.020. - DOI - PMC - PubMed