. 2017 Dec 1;127(12):4498-4515.
doi: 10.1172/JCI91553. Epub 2017 Nov 13.

JAK2-binding long noncoding RNA promotes breast cancer brain metastasis

Affiliations

JAK2-binding long noncoding RNA promotes breast cancer brain metastasis

Shouyu Wang et al. J Clin Invest. .

Expression of concern in

  • Expression of Concern for JAK2-binding long noncoding RNA promotes breast cancer brain metastasis.
    Wang S, Liang K, Hu Q, Li P, Song J, Yang Y, Yao J, Mangala LS, Li C, Yang W, Park PK, Hawke DH, Zhou J, Zhou Y, Xia W, Hung MC, Marks JR, Gallick GE, Lopez-Berestein G, Flores ER, Sood AK, Huang S, Yu D, Yang L, Lin C. Wang S, et al. J Clin Invest. 2025 Oct 1;135(19):e200302. doi: 10.1172/JCI200302. eCollection 2025 Oct 1. J Clin Invest. 2025. PMID: 41031879 Free PMC article. No abstract available.

Abstract

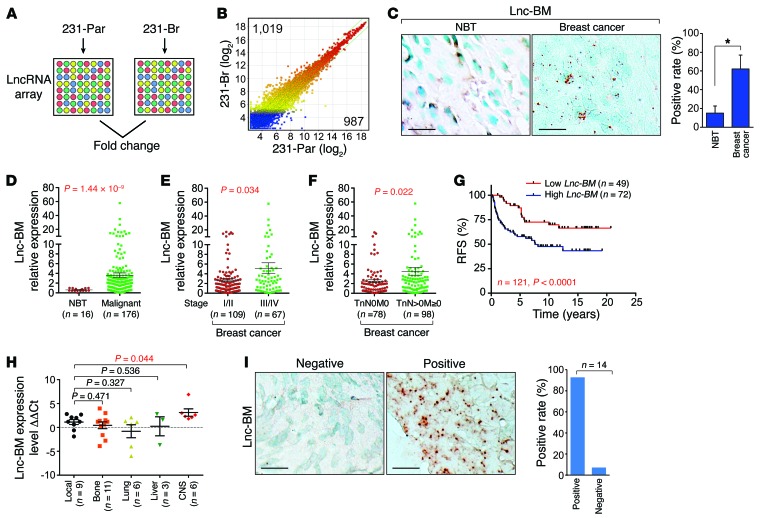
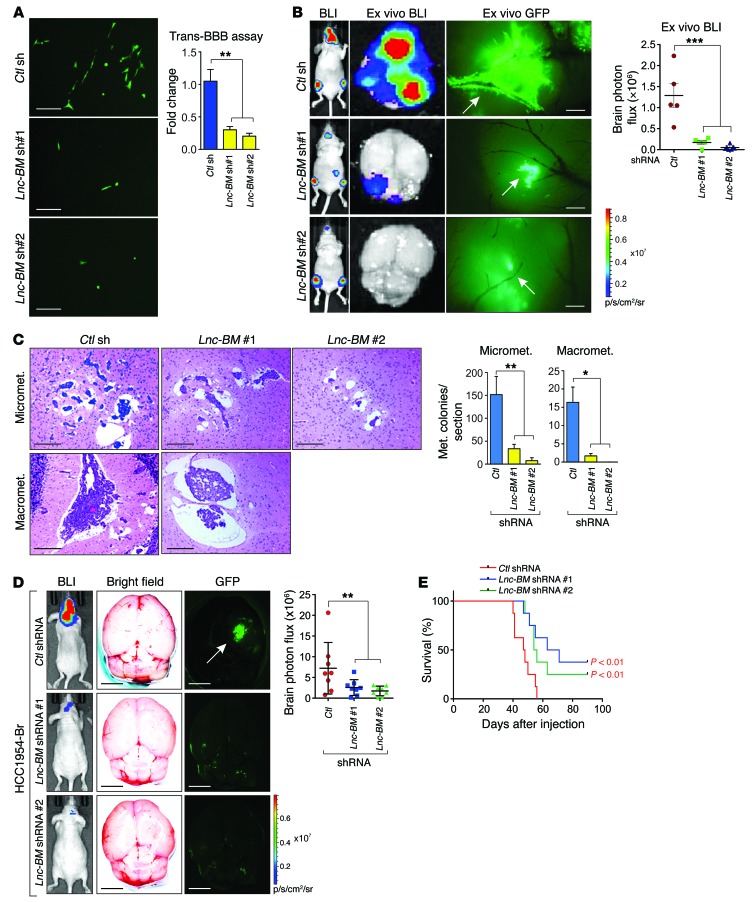
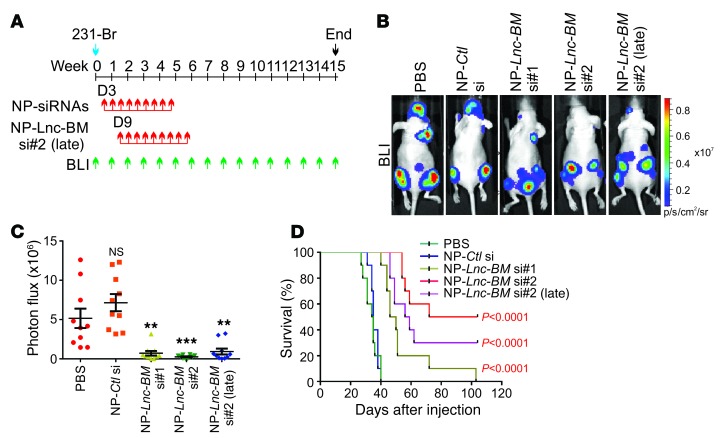
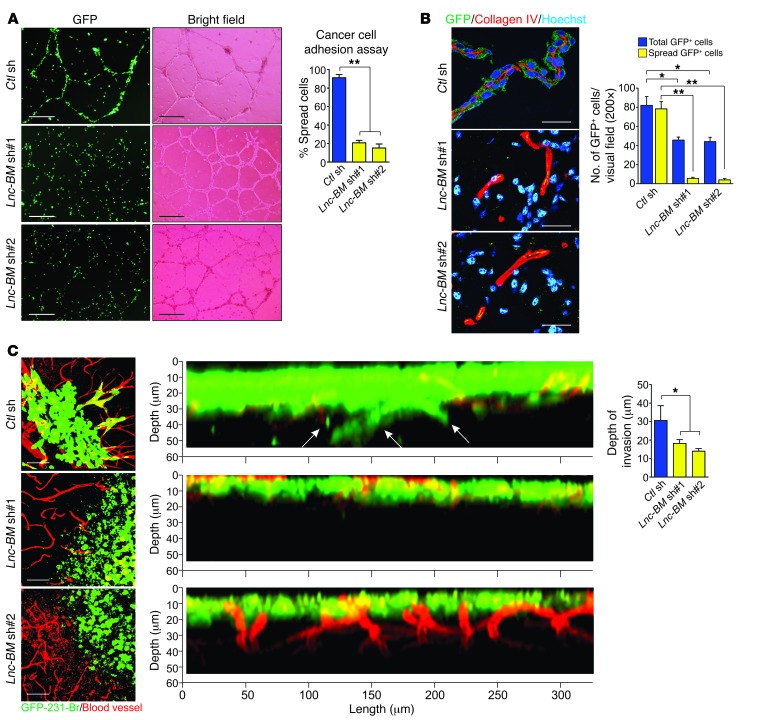
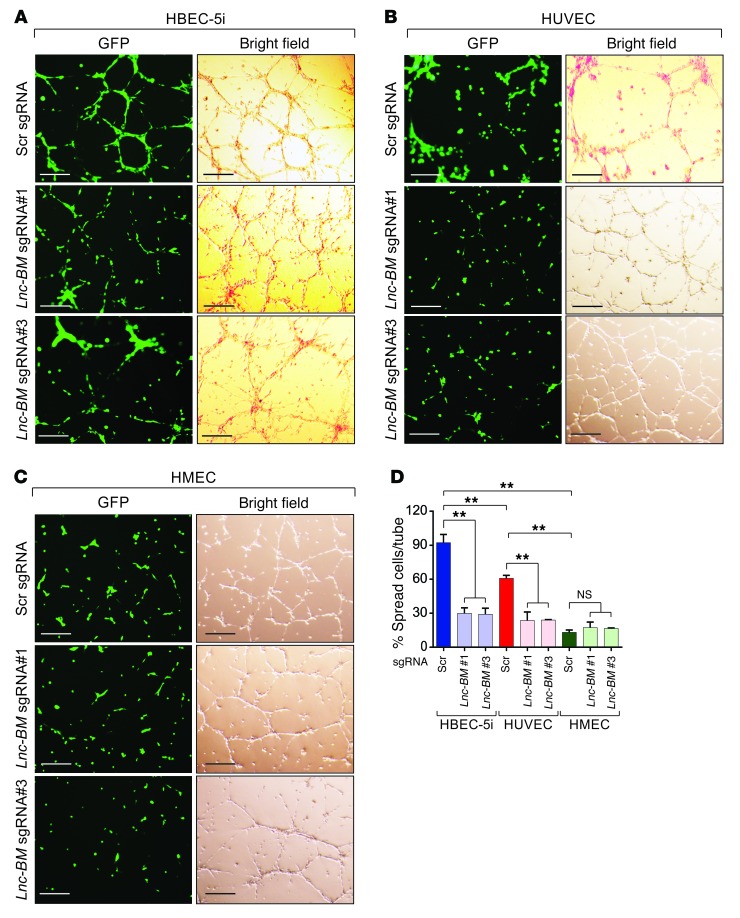
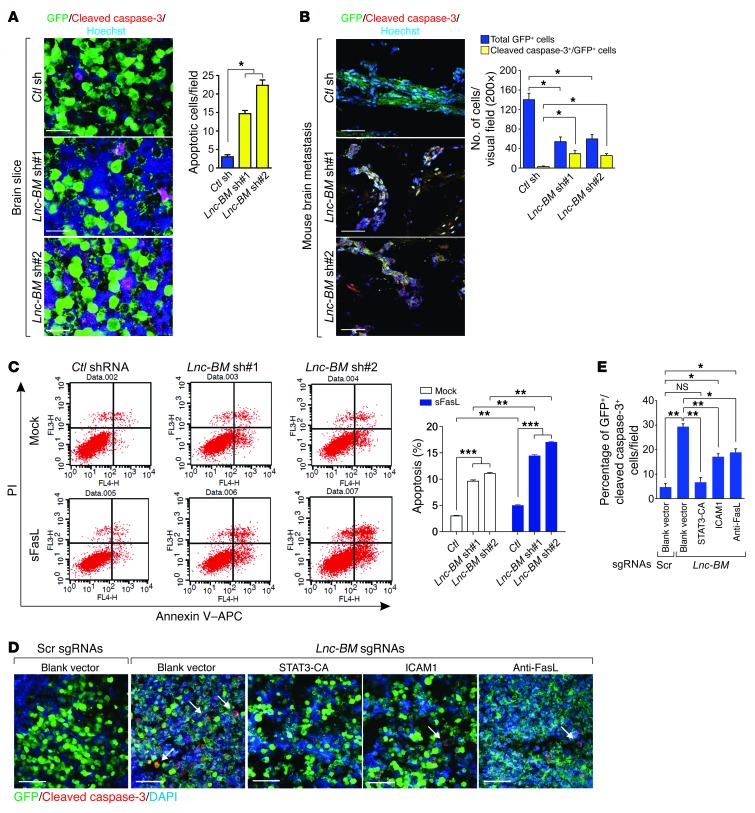
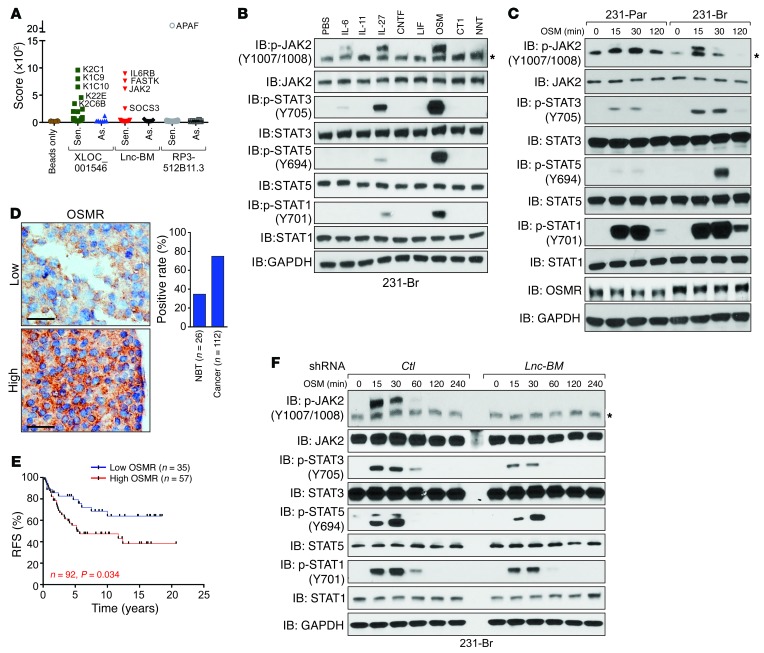
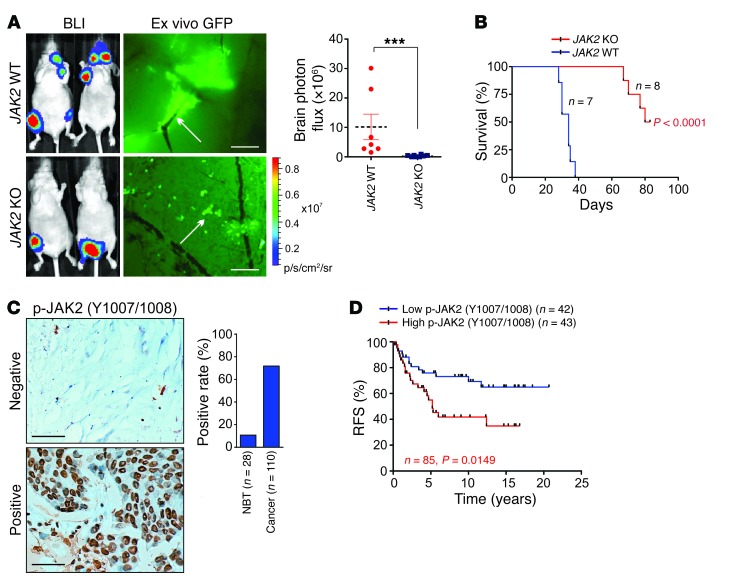
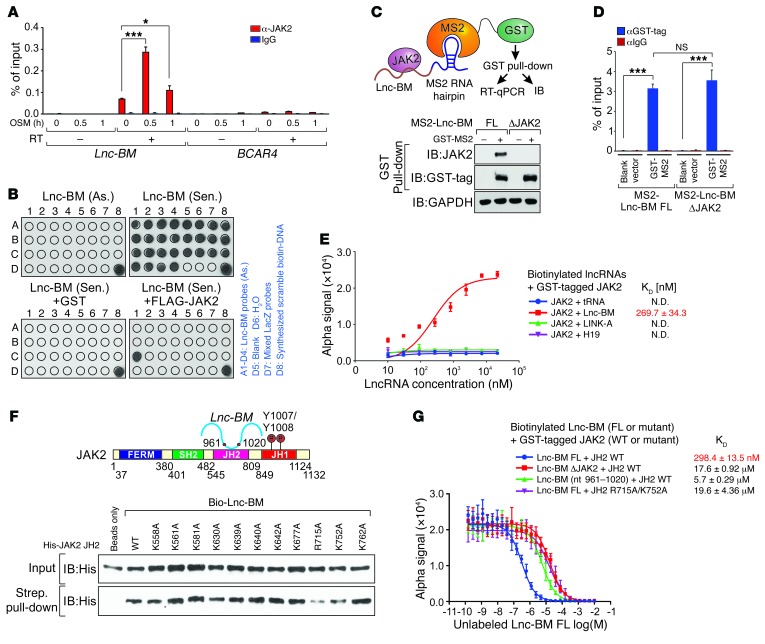
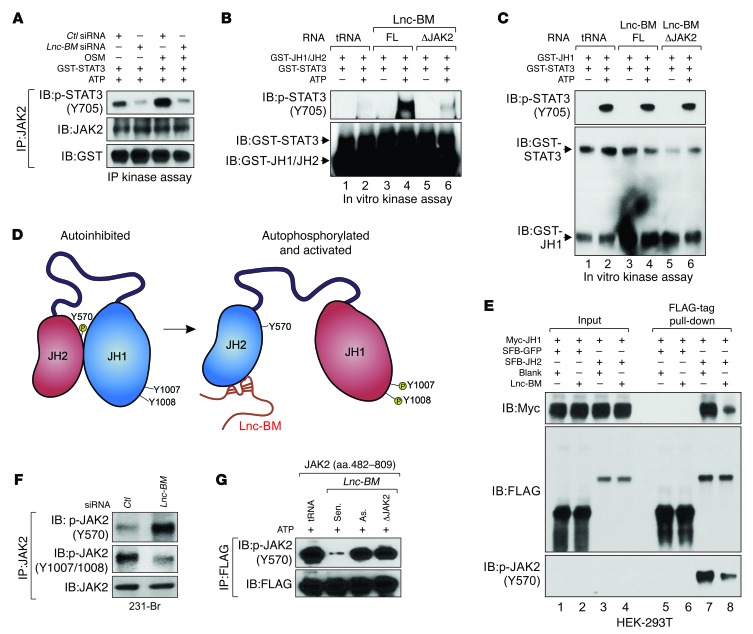
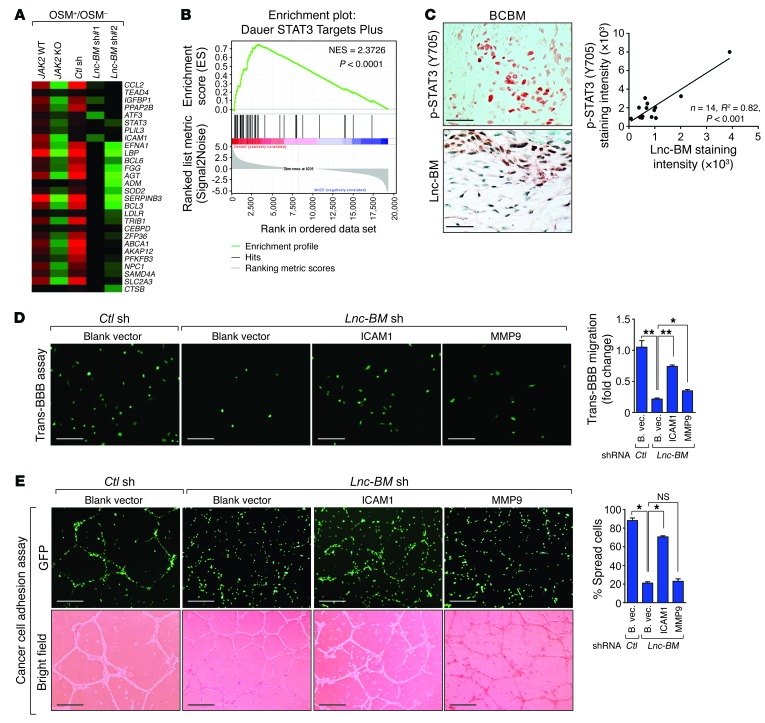
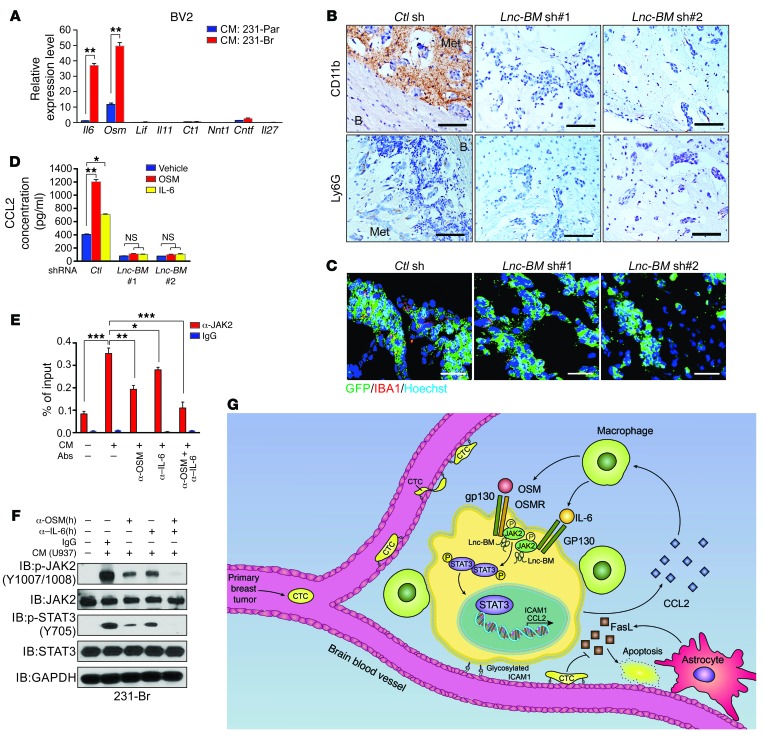
Conventional therapies for breast cancer brain metastases (BCBMs) have been largely ineffective because of chemoresistance and impermeability of the blood-brain barrier. A comprehensive understanding of the underlying mechanism that allows breast cancer cells to infiltrate the brain is necessary to circumvent treatment resistance of BCBMs. Here, we determined that expression of a long noncoding RNA (lncRNA) that we have named lncRNA associated with BCBM (Lnc-BM) is prognostic of the progression of brain metastasis in breast cancer patients. In preclinical murine models, elevated Lnc-BM expression drove BCBM, while depletion of Lnc-BM with nanoparticle-encapsulated siRNAs effectively treated BCBM. Lnc-BM increased JAK2 kinase activity to mediate oncostatin M- and IL-6-triggered STAT3 phosphorylation. In breast cancer cells, Lnc-BM promoted STAT3-dependent expression of ICAM1 and CCL2, which mediated vascular co-option and recruitment of macrophages in the brain, respectively. Recruited macrophages in turn produced oncostatin M and IL-6, thereby further activating the Lnc-BM/JAK2/STAT3 pathway and enhancing BCBM. Collectively, our results show that Lnc-BM and JAK2 promote BCBMs by mediating communication between breast cancer cells and the brain microenvironment. Moreover, these results suggest targeting Lnc-BM as a potential strategy for fighting this difficult disease.

Keywords: Breast cancer; Cell Biology; Oncology.


Conflict of interest statement

Conflict of interest: The authors have declared that no conflict of interest exists.

Figures

Figure 1
Figure 1. Lnc-BM correlates with breast cancer and BCBM.
(A and B) LncRNA profiling in 231-Par and 231-Br cells. (C) RNAscope detection of Lnc-BM expression in human breast cancer and adjacent normal tissues. Left panel: Representative images. Right panel: Statistical analysis; 29 normal breast tissues (NBT), 118 breast cancer tissues, unpaired Student’s t test. Scale bars: 100 μm. (DF) TissueScan Cancer Panels were analyzed by RT-qPCR for Lnc-BM expression in human breast cancer and adjacent normal tissues (1-way ANOVA). (G) Kaplan-Meier recurrence-free survival (RFS) analysis of Lnc-BM expression in breast cancer patients (n = 49 and 72 tissues, respectively, log rank test). (H) Determination of Lnc-BM expression in primary breast cancers with recurrence to local or distant sites by RT-qPCR. ΔCt: The Ct value of GAPDH was subtracted from the Ct value of Lnc-BM; ΔΔCt: the median of ΔCt of Lnc-BM from all samples was subtracted from the ΔCt value of each sample (1-way ANOVA). (I) RNAscope detection of Lnc-BM expression in BCBM tissues (n = 14 tissues). Scale bars: 100 μm. Data are mean ± SEM, *P < 0.05.
Figure 2
Figure 2. Lnc-BM is required and sufficient to promote BCBM.
(A) In vitro BBB transmigration activity of the 231-Br cells harboring control or Lnc-BM shRNAs. The number of transmigrated cells relative to the control cells is plotted (n = 3 independent experiments, unpaired Student’s t test). Scale bars: 100 μm. (B) Bioluminescence imaging (BLI) (n = 5 animals) of mouse, 4 weeks after intracardiac injection of 231-Br cells harboring indicated shRNAs (1-way ANOVA). Scale bars: 200 μm. White arrows: brain blood vessels. (C) Representative images and statistical analysis of H&E staining of mouse brain tumor burden at 35 days after intracardiac injection of 231-Br cells harboring indicated shRNAs (1-way ANOVA). Scale bars: 200 μm. n = 5 animals per group, 3 sections per brain. Micromet., micrometastatic lesions; Macromet., macrometastatic lesions. (D) Representative images of BLI (n = 8 animals), brain ex vivo bright field and ex vivo GFP, and statistical analysis of brain area photo flux (right panel) 5 weeks after intraarterial injection of HCC1954-Br cells stably expressing indicated shRNAs (1-way ANOVA). White arrow: brain metastatic lesions. Scale bars: 3 mm. (E) Kaplan-Meier plot of survival in the experiment of D (n = 8 animals per group, log rank test). Data are mean ± SEM, *P < 0.05, **P < 0.01, ***P < 0.001.
Figure 3
Figure 3. Inhibition of Lnc-BM represses BCBM.
(A) Flowchart of the experiments. (B and C) Representative BLI images (B) and quantification of BLI in the head region (C) of mice 4 weeks after intracardiac injection of 231-Br cells followed by i.v. administration of indicated nanoparticle-siRNAs (NP-siRNAs) (n = 10 animals, 1-way ANOVA). (D) Kaplan-Meier plot of survival in the experiment of B (n = 10 animals, log rank test). Data are mean ± SEM, **P < 0.01, ***P < 0.001.
Figure 4
Figure 4. Lnc-BM is required for brain metastatic cancer cell vascular co-option.
(A) 231-Br cells harboring indicated shRNAs were subjected to cancer cell adhesion assay. The number of cancer cells attached and spread along HUVECs relative to total cancer cells was plotted (n = 3 independent experiments, unpaired Student’s t test). Scale bars: 200 μm. (B) Immunofluorescence (IF) with indicated antibodies in brain metastasis–bearing mice 35 days after intracardiac injection of 231-Br cells harboring indicated shRNAs (n = 3 independent experiments, paired Student’s t test). Scale bars: 50 μm. (C) Representative confocal images of cancer cell vascular co-option and quantification of infiltrated depth (right panel) of brain slices cocultured with 231-Br cells harboring indicated shRNAs (n = 3 independent experiments, unpaired Student’s t test) . Scale bars: 50 μm. White arrows: infiltrated cells. Data are mean ± SEM, *P < 0.05, **P < 0.01.
Figure 5
Figure 5. Lnc-BM promotes cancer cell adhesion to brain endothelium.
Representative images (AC) and statistical analysis (D) of cancer cell adhesion assay of 231-Br cells harboring indicated sgRNAs cocultured with HBECs (A), HUVECs (B), or HMECs (C). Scr, scramble. Scale bars: 200 μm. Data are mean ± SEM, n = 3 independent experiments. NS, P > 0.05; **P < 0.01; 1-way ANOVA.
Figure 6
Figure 6. Lnc-BM impedes cancer cells from FasL-induced apoptosis.
(A and B) IF staining of cleaved caspase-3 in brain slices cocultured with 231-Br cells harboring indicated shRNAs (A) or in brain metastatic lesions (B, related to Figure 2C). Left panels: Representative images. Right panel: Statistical analysis (n = 3 independent experiments, unpaired Student’s t test). Scale bars: 100 μm. (C) FACS analyses of 231-Br cells transfected with indicated shRNAs followed by sFasL (200 ng/ml) treatment for 24 hours (n = 3 independent experiments, unpaired Student’s t test). (D and E) IF staining of cleaved caspase-3 in brain slices cocultured with 231-Br cells harboring scramble or Lnc-BM sgRNAs, followed by transfection of indicated expression constructs. (D) Representative images. (E) Statistical analysis (n = 3 independent experiments, unpaired Student’s t test). White arrows: apoptotic cells. Scale bars: 200 μm. Data are mean ± SEM; NS, P > 0.05; *P < 0.05, **P < 0.01, ***P < 0.001.
Figure 7
Figure 7. Lnc-BM–mediated signaling pathway triggered by OSM is required for BCBM.
(A) Summary of protein identification score revealed by lncRNA pull-down followed by mass spectrometry analysis using sense (Sen.) or antisense (As.) transcripts of indicated lncRNAs. (B and C) IB detection using indicated antibodies in 231-Br cells treated with the indicated cytokines for 30 minutes (B) or in 231-Br and 231-Par cells treated with OSM (50 ng/ml) for the indicated times. *Unspecific band. (D) IHC staining of OSMR in human breast cancer (n = 112 tissues) and adjacent normal tissues (NBT; n = 26 tissues). Scale bars: 100 μm. (E) Kaplan-Meier RFS analysis of OSMR expression in breast cancer patients detected by IHC (n = 35 and 57 tissues, respectively, log rank test). (F) IB detection using indicated antibodies in 231-Br cells harboring indicated shRNAs treated with OSM for the indicated times. *Unspecific band.
Figure 8
Figure 8. JAK2 is required for BCBM.
(A) BLI image (n = 7 and 8 animals) of mice 4 weeks after intracardiac injection of indicated cells. Left panel: Representative images. Right panel: Statistical analysis (1-way ANOVA). Scale bars: 200 μm. White arrows: mouse brain blood vessel. (B) Kaplan-Meier plot of brain-metastasis-free survival in the experiment of (A) (n = 7 and 8 animals, respectively, log rank test). (C) IHC staining of p-JAK2 in human breast cancer (n = 110 tissues) and adjacent normal tissues (NBT) (n = 28 tissues). Scale bars: 100 μm. (D) Kaplan-Meier RFS analysis of p-JAK2 in breast cancer patients detected by IHC (n = 42 and 43 tissues, respectively, log rank test). Data are mean ± SEM, ***P < 0.001.
Figure 9
Figure 9. Lnc-BM associates with JAK2 in vitro and in vivo.
(A) RIP-qPCR detection of the indicated RNAs retrieved using indicated antibodies in 231-Br cells with OSM treatment for the indicated times (n = 3 independent experiments, paired Student’s t test). (B) In vitro RNA pull-down coupled with dot-blot assay using indicated RNA transcripts and recombinant proteins. Right panel: Annotation for each dot. (C and D) Graphic illustration of MS2-TRAP assay (C, top panel). IB (C, bottom panel) and RT-qPCR detection of MS2-Lnc-BM (D) of anti-GST immunoprecipitates in cells transfected with indicated expression constructs, followed by OSM stimulation (n = 3 independent experiments, paired Student’s t test). (E) Saturation curve KD determination of interaction between indicated lncRNAs and recombinant GST-tagged JAK2 (n = 3 independent experiments). (F) Top panel: Graphic illustration of Lnc-BM–JAK2 interaction. Bottom panel: IB detection of streptavidin pull-down using His-tagged JH2 WT/mutants and biotinylated Lnc-BM. (G) Competition binding assay KD determination of interaction between Lnc-BM FL/mutants and recombinant JH2 WT/mutants, with unlabeled Lnc-BM titrated from 10 μM to 0.1 nM (n = 3 independent experiments). Data are mean ± SEM; NS, P > 0.05; *P < 0.05, ***P < 0.001.
Figure 10
Figure 10. Lnc-BM modulates kinase activity of JAK2.
(A) Kinase assay using anti-JAK2 immunoprecipitates retrieved from 231-Br cells transfected with indicated siRNAs followed by OSM treatment. (B and C) In vitro kinase assay using recombinant JAK2 JH1/JH2 domain (B) or JAK2 JH1 domain (C), GST-STAT3, and indicated RNA transcripts in the presence and absence of ATP. (D) Graphic illustration of Lnc-BM–mediated JAK2 JH1/JH2 domain conformational alteration from autoinhibition to activation. (E) FLAG-tag pull-down followed by IB detection using antibodies in HEK-293T cells transfected with indicated vectors. (F) Anti-JAK2 immunoprecipitates were detected using indicated antibodies in 231-Br cells transfected with indicated siRNA. (G) Kinase assay using anti-FLAG immunoprecipitates in γ-2A cells transfected with SFB-JAK2 (aa 482–809), in the presence of indicated RNA transcripts and ATP.
Figure 11
Figure 11. ICAM1 facilitates breast cancer cell vascular co-option and invasion.
(A) Heatmap representation of the expression of STAT3 target genes in indicated cells treated with 50 ng/ml OSM or vehicle for 4 hours. The colors represent the fold changes of gene expression induced by OSM over vehicle. (B) GSEA of STAT3 target gene signature in A. NES, normalized enrichment score. (C) Top panel: Representative images of p-STAT3 and Lnc-BM staining in brain metastatic tissues of breast cancers. Bottom panel: Pearson’s correlation analysis (n = 14 tissues). Scale bars: 100 μm. (D and E) Trans-BBB assay (D) or cancer cell adhesion assay (E) was performed in Lnc-BM–deficient 231-Br cells stably overexpressing ICAM1 and MMP9 (n = 3 independent experiments, paired Student’s t test). B. vec., blank vector. Scale bars: 100 μm (D), 200 μm (E). Data are mean ± SEM; NS, P > 0.05; *P < 0.05, **P < 0.01.
Figure 12
Figure 12. Lnc-BM promotes recruitment of macrophages into the metastatic niche to form positive-feedback loop.
(A) RT-qPCR analysis of IL6ST-associated cytokine expression in BV2 cells incubated with conditioned media from indicated cells (n = 3 independent experiments, paired Student’s t test). (B and C) IHC detection of CD11b and Ly6G (B) or IF staining of IBA1 (C) in brain metastatic lesions of 231-Br cells harboring indicated shRNAs (related to Figure 2C; n = 5 animals per group, 3 sections per brain). B, brain tissue; Met, metastatic cancer cells. Scale bars: 200 μm (B), 100 μM (C). (D) ELISA detection of CCL2 concentration in conditioned media of 231-Br cells harboring indicated shRNAs treated with OSM (50 ng/ml) or IL-6 (50 ng/ml) for 12 hours (n = 3 independent experiments, paired Student’s t test). (E and F) RIP quantitative real-time PCR detection of Lnc-BM retrieved by indicated antibodies (E) or IB detection using indicated antibodies (F) in 231-Br cells treated with conditioned media from primed U937 cells in addition to indicated human antibodies (n = 3 independent experiments, paired Student’s t test; E). (G) Model of the action of Lnc-BM in mediating BCBM. Data are mean ± SEM; *P < 0.05, **P < 0.01, ***P < 0.001.

References

    1. Brufsky AM, et al. Central nervous system metastases in patients with HER2-positive metastatic breast cancer: incidence, treatment, and survival in patients from registHER. Clin Cancer Res. 2011;17(14):4834–4843. doi: 10.1158/1078-0432.CCR-10-2962. - DOI - PubMed
    1. Kirsch DG, Loeffler JS. Brain metastases in patients with breast cancer: new horizons. Clin Breast Cancer. 2005;6(2):115–124. doi: 10.3816/CBC.2005.n.013. - DOI - PubMed
    1. Aversa C, et al. Metastatic breast cancer subtypes and central nervous system metastases. Breast. 2014;23(5):623–628. doi: 10.1016/j.breast.2014.06.009. - DOI - PubMed
    1. Kennecke H, et al. Metastatic behavior of breast cancer subtypes. J Clin Oncol. 2010;28(20):3271–3277. doi: 10.1200/JCO.2009.25.9820. - DOI - PubMed
    1. Steeg PS, Camphausen KA, Smith QR. Brain metastases as preventive and therapeutic targets. Nat Rev Cancer. 2011;11(5):352–363. doi: 10.1038/nrc3053. - DOI - PMC - PubMed

Publication types

MeSH terms