. 2017 Dec 1;127(12):4477-4487.
doi: 10.1172/JCI90542. Epub 2017 Nov 13.

Amphiphysin (BIN1) negatively regulates dynamin 2 for normal muscle maturation

Affiliations

Amphiphysin (BIN1) negatively regulates dynamin 2 for normal muscle maturation

Belinda S Cowling et al. J Clin Invest. .

Abstract

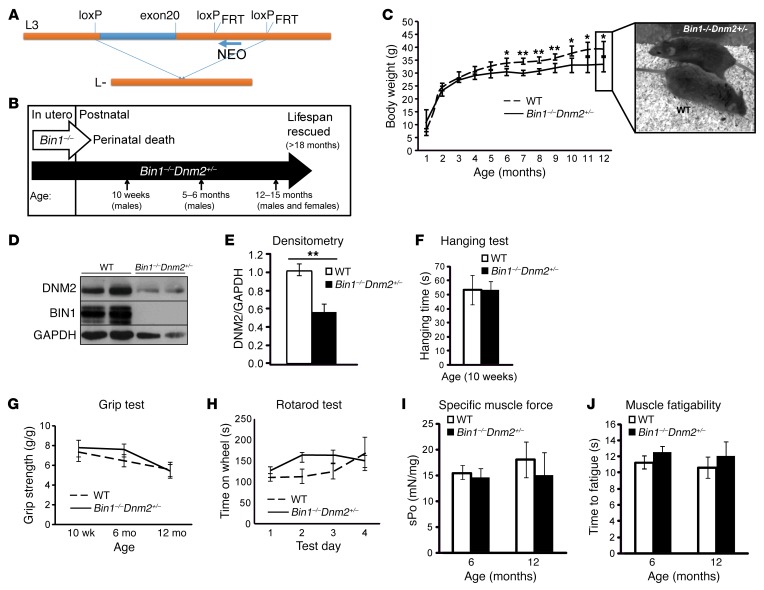
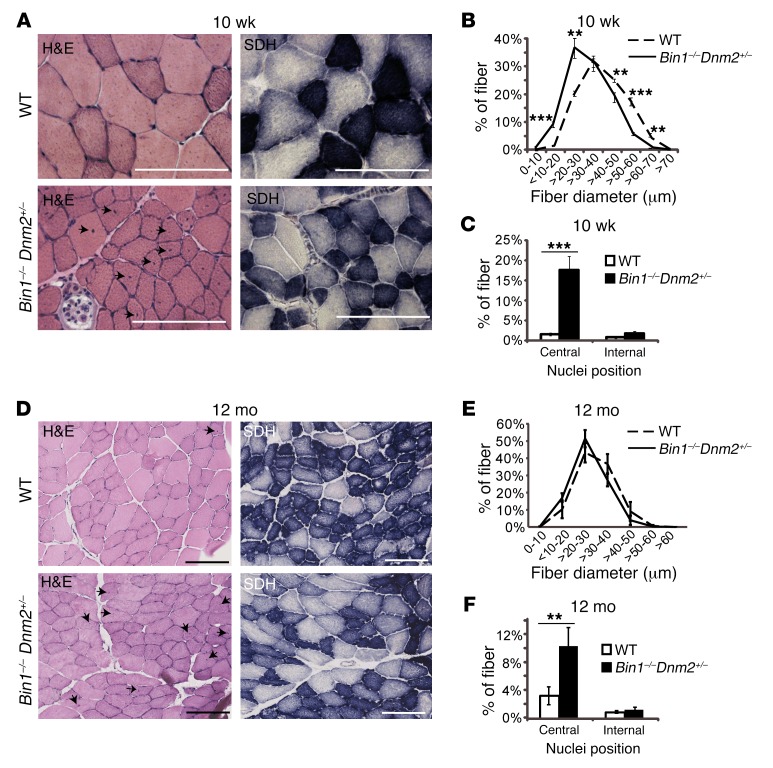
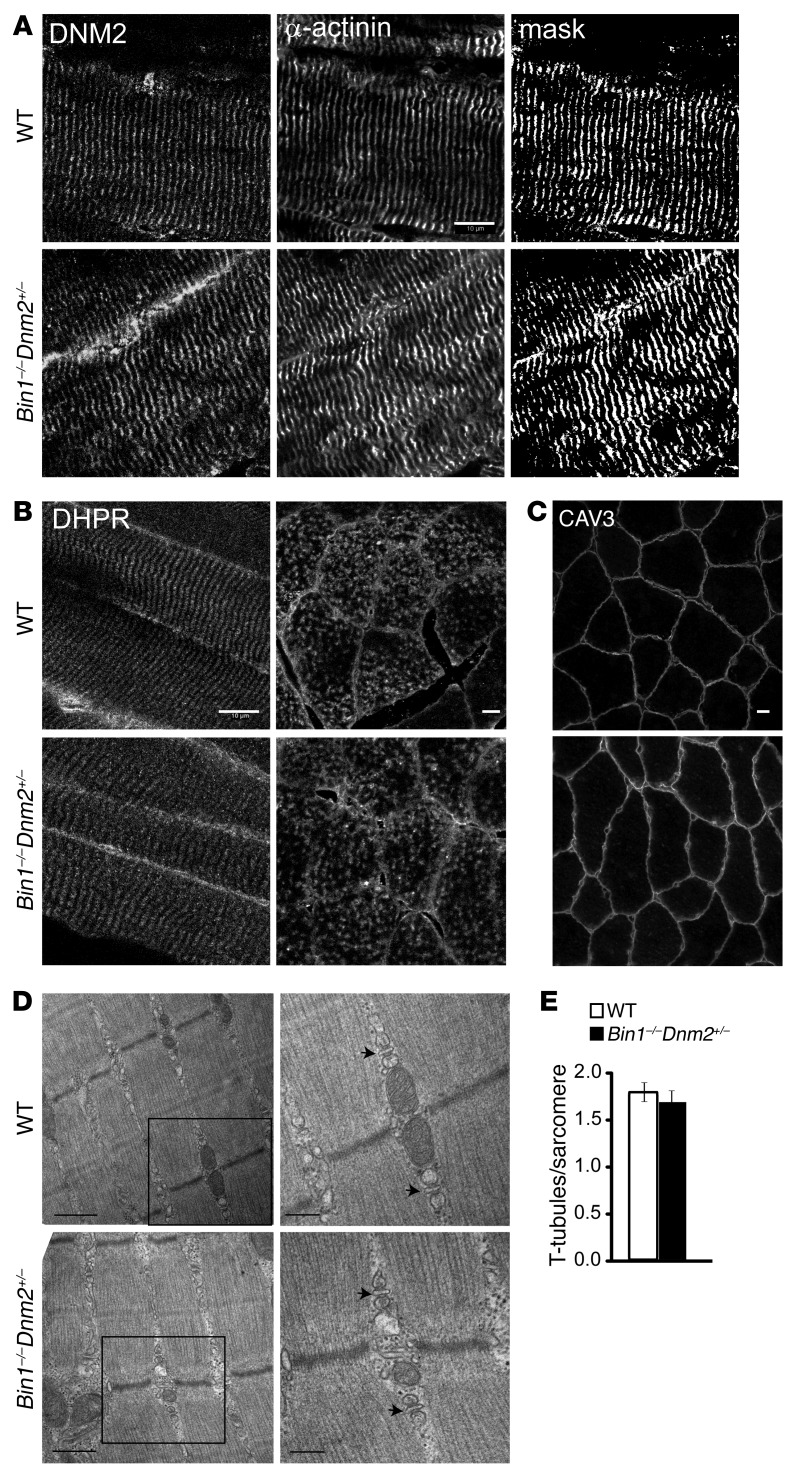
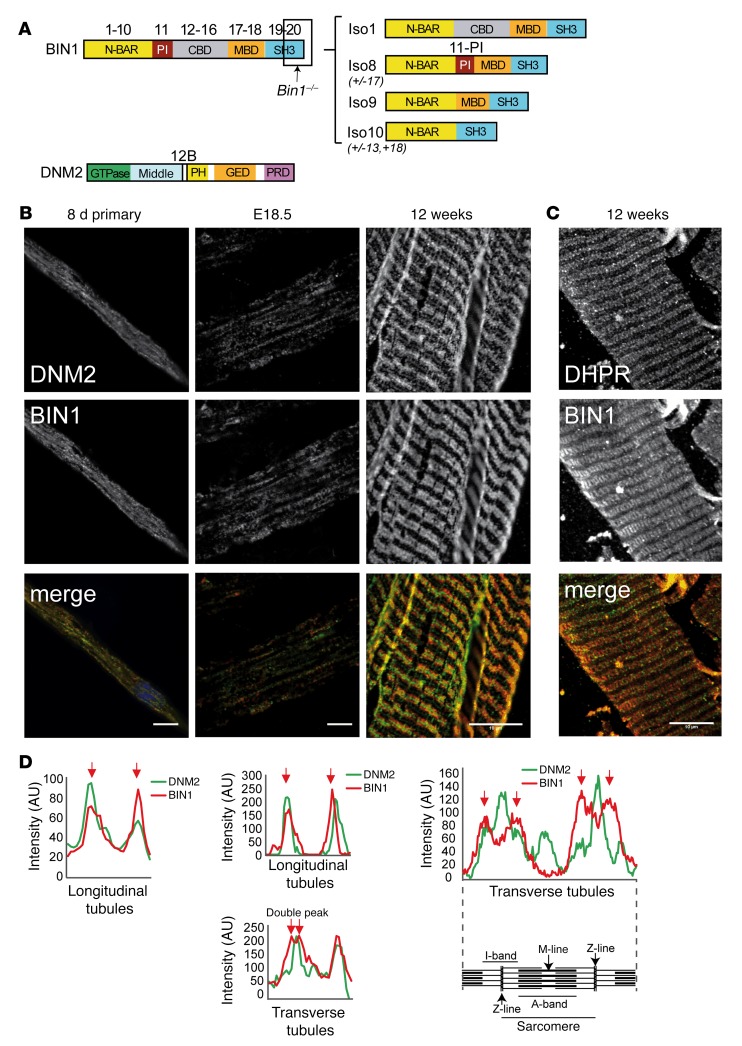
Regulation of skeletal muscle development and organization is a complex process that is not fully understood. Here, we focused on amphiphysin 2 (BIN1, also known as bridging integrator-1) and dynamin 2 (DNM2), two ubiquitous proteins implicated in membrane remodeling and mutated in centronuclear myopathies (CNMs). We generated Bin1-/- Dnm2+/- mice to decipher the physiological interplay between BIN1 and DNM2. While Bin1-/- mice die perinatally from a skeletal muscle defect, Bin1-/- Dnm2+/- mice survived at least 18 months, and had normal muscle force and intracellular organization of muscle fibers, supporting BIN1 as a negative regulator of DNM2. We next characterized muscle-specific isoforms of BIN1 and DNM2. While BIN1 colocalized with and partially inhibited DNM2 activity during muscle maturation, BIN1 had no effect on the isoform of DNM2 found in adult muscle. Together, these results indicate that BIN1 and DNM2 regulate muscle development and organization, function through a common pathway, and define BIN1 as a negative regulator of DNM2 in vitro and in vivo during muscle maturation. Our data suggest that DNM2 modulation has potential as a therapeutic approach for patients with CNM and BIN1 defects. As BIN1 is implicated in cancers, arrhythmia, and late-onset Alzheimer disease, these findings may trigger research directions and therapeutic development for these common diseases.

Keywords: Muscle Biology; Neuromuscular disease; Skeletal muscle.


Conflict of interest statement

Conflict of interest: H. Tasfaout, J. Laporte, and B.S. Cowling are inventors on a patent (number Ep13306440.2 - 1412 [EP20130306440], filed 10/28/2013, second file international extension [PCT] PCT/EP2014/072466, 10/20/2014) for targeting DNM2 for the treatment of centronuclear myopathies, and cofounders of Dynacure. J. Laporte and B.S. Cowling are scientific advisors for Dynacure.

Figures

Figure 1
Figure 1. Dnm2 downregulation rescues the neonatal lethality of Bin1–/– mice.
(A) Targeted disruption of mouse Bin1 gene. Exon 20 (blue) and surrounding intronic region (orange). (B) Overview of lifespan and time points used to analyze Bin1–/– Dnm2+/– mice. (C) Mice whole-body weight, and representative photo of mice at 12 months of age. Note that all genotyped Bin1–/– Dnm2+/– mice survived beyond 12 months of age. (D) Immunoblot analysis of DNM2 and BIN1 protein expression from muscle lysates. (E) Relative level of DNM2 protein expression was determined by densitometry of DNM2 signal standardized to GAPDH. n = 4 mice/genotype. (F) Hanging test where 10-week-old mice were required to hang from a cage lid for up to 60 seconds. (G) Four-paw grip test. (H) Rotarod test performed under acceleration mode (4–40 rpm in 5 minutes). n = 3 trials/mouse/day, 6-month-old mice. (I) Specific muscle force (sPo) of the tibialis anterior (TA) muscle (mN force/mg TA muscle). (J) Fatigue of the TA muscle, measured as the time taken to reach 50% of the maximum muscle force (seconds). All graphs depict the mean ± SEM. Statistical analysis was performed using an unpaired 2-tailed Student’s t test for all graphs except H, where a 2-way ANOVA followed by Dunn’s multiple comparison test was used. *P < 0.05, **P < 0.01. n = minimum 5 mice per group for C, FJ.
Figure 2
Figure 2. Skeletal muscle histology is mildly affected in surviving Bin1–/– mice with reduced DNM2 expression.
Transverse TA sections from 10-week-old (10 wk) (A) or 12-month-old (12 mo) (D) mice were stained with H&E or for SDH. Arrows point to mislocalized nuclei. Scale bars: 100 μm. H&E–stained muscle sections were then analyzed for fiber area for 10 wk (B) and 12 mo (E). Fiber diameter is grouped into 10-μm intervals, and represented as the percentage of total fibers. (C and F) The frequency of fibers with central or internal nuclei were scored. Internal nuclei are defined as neither subsarcolemmal nor central. All graphs depict the mean ± SEM. Statistical analysis was performed using an unpaired 2-tailed Student’s t test. **P < 0.01, ***P < 0.001, n = minimum 5 mice per group.
Figure 3
Figure 3. Normal muscle structure and ultrastructure in Bin1–/– Dnm2+/– mice.
(A) Longitudinal muscle sections were costained for DNM2 (left panel) and α-actinin (middle panel) and imaged by confocal microscopy. Mask image shows areas of colocalization (right panel). Scale bar: 10 μm. (B) Longitudinal (left panel) and transverse (right panel) muscle sections were stained with the T-tubule marker DHPR. Scale bars: 10 μm. (C) Transverse muscle sections stained with CAV3 antibody and viewed by confocal microscopy. Scale bar: 10 μm. (D) Longitudinal muscle sections viewed by transmission electron microscopy. Low-magnification images are in the left panel (scale bar: 0.5 μm); high magnification images are shown in the right panel (scale bar: 200 nm). Arrows point to the triad. All samples are from 12-month-old mice. (E) The number of T-tubules per sarcomere was calculated from TEM images in D. Graph depicts the mean ± SEM. Statistical analysis was performed using an unpaired 2-tailed Student’s t test, n = 3 mice/genotype.
Figure 4
Figure 4. BIN1 and DNM2 in skeletal muscle development.
(A) BIN1 and DNM2 protein domains; corresponding exons and isoforms are shown. N-BAR, N-terminal amphipathic helix and Bin-amphiphysin-Rvs domain; PI, phosphoinositide-binding domain; CBD, clathrin-binding domain; MBD, MYC-binding domain; SH3, Src homology domain; PH, pleckstrin homology domain; GED, GTPase effector domain. Region targeted by exon 20 Bin1–/– mice is indicated. Position of peptides encoded by alternative exons 11 and 12B indicated (not to scale). Predominant BIN1 isoforms are depicted on the right. Iso1 (brain), Iso8 (skeletal muscle), Iso9 (ubiquitous), Iso10 (ubiquitous, cardiac muscle) (adapted from ref. 24). (B) Immunofluorescence staining of primary myotubes (differentiated for 8 days [8d]) and murine muscles at embryonic day 18.5 (E18.5) and in adult (12 weeks) from WT mice. E18.5 muscles have longitudinal (predominant in this image) or transversal triads. DNM2 (upper panel, green in merge) and BIN1 (middle panel, red in merge) immunolabeling is shown. Scale bars: 10 μm. (C) Immunofluorescence staining of semi-thin (200 μm) sections from WT mice, DHPR (upper panel, red in merge), and BIN1 (middle panel, green in merge). Scale bar: 10 μm. (D) Intensity scans spanning 1 complete sarcomere from the above images.
Figure 5
Figure 5. BIN1 inhibits DNM2 in an isoform-dependent manner.
(A) Crystal structure model of nucleotide-free human dynamin 1 (adapted from Faeber et al., ref. 52) using PyMOL. The GTPase domain (green), middle domain (light blue), and GTPase effector domain (GED, orange) forming the stalk, and the PH domain (yellow), are depicted, with the sites of DNM2 mutations linked to CNM indicated (red). The peptide encoded by 12B in human (CYYTEQLVTC) spans from position 497 (black 1), followed by 18 unresolved amino acids, and then amino acid 518 (black 2). (B) Cosedimentation assays were performed with recombinant proteins to determine protein binding (in pellet fraction) relative to total protein (pellet+soluble, see Supplemental Figure 7 for raw data), in the presence of liposomes and PIP2. Results are represented as a fold difference versus DNM2 alone. (C) Malachite green assay with DNM2 (±12B) and BIN1 (+exon 11 [Iso8] and –exon 11 [Iso9]) isoforms, with DNM2/BIN1 at a ratio of 1:4. Brain polar lipids with additional 5% PIP2 were used. Results are shown as catalytic rate (mol/mol/min). Results in B and C are an average of 2 (C) or 4 (B) independent experiments. Graph represents the mean + SEM. One-way (B and C) or 2-way (C) ANOVA test was used as described in the Methods section. *P < 0.05, **P < 0.01, ***P < 0.001.

References

    1. Towler MC, Kaufman SJ, Brodsky FM. Membrane traffic in skeletal muscle. Traffic. 2004;5(3):129–139. doi: 10.1111/j.1600-0854.2003.00164.x. - DOI - PubMed
    1. Cowling BS, Toussaint A, Muller J, Laporte J. Defective membrane remodeling in neuromuscular diseases: insights from animal models. PLoS Genet. 2012;8(4):e1002595. doi: 10.1371/journal.pgen.1002595. - DOI - PMC - PubMed
    1. Lee E, et al. Amphiphysin 2 (Bin1) and T-tubule biogenesis in muscle. Science. 2002;297(5584):1193–1196. doi: 10.1126/science.1071362. - DOI - PubMed
    1. David C, McPherson PS, Mundigl O, de Camilli P. A role of amphiphysin in synaptic vesicle endocytosis suggested by its binding to dynamin in nerve terminals. Proc Natl Acad Sci U S A. 1996;93(1):331–335. doi: 10.1073/pnas.93.1.331. - DOI - PMC - PubMed
    1. Bitoun M, et al. Mutations in dynamin 2 cause dominant centronuclear myopathy. Nat Genet. 2005;37(11):1207–1209. doi: 10.1038/ng1657. - DOI - PubMed

Publication types

MeSH terms