. 2017 Dec;23(12):1454-1465.
doi: 10.1038/nm.4429. Epub 2017 Nov 13.

UCP1-independent signaling involving SERCA2b-mediated calcium cycling regulates beige fat thermogenesis and systemic glucose homeostasis

Affiliations

UCP1-independent signaling involving SERCA2b-mediated calcium cycling regulates beige fat thermogenesis and systemic glucose homeostasis

Kenji Ikeda et al. Nat Med. 2017 Dec.

Abstract

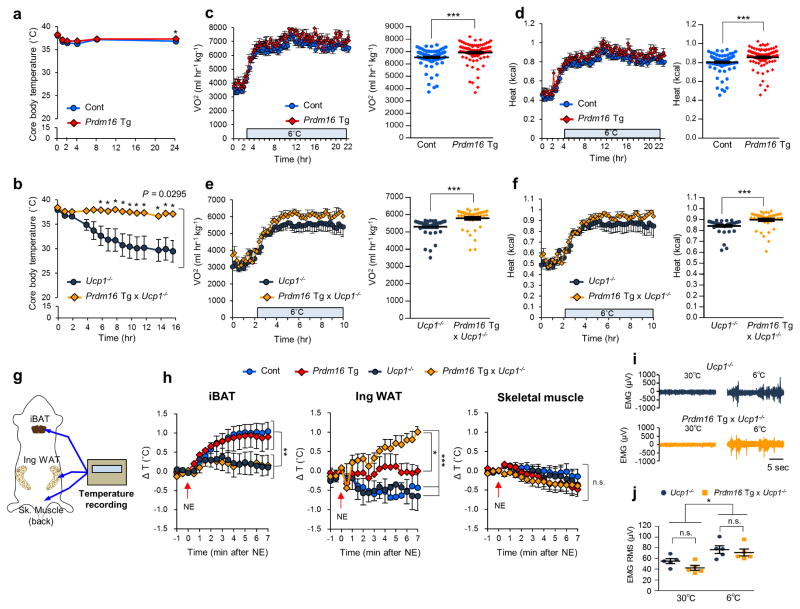
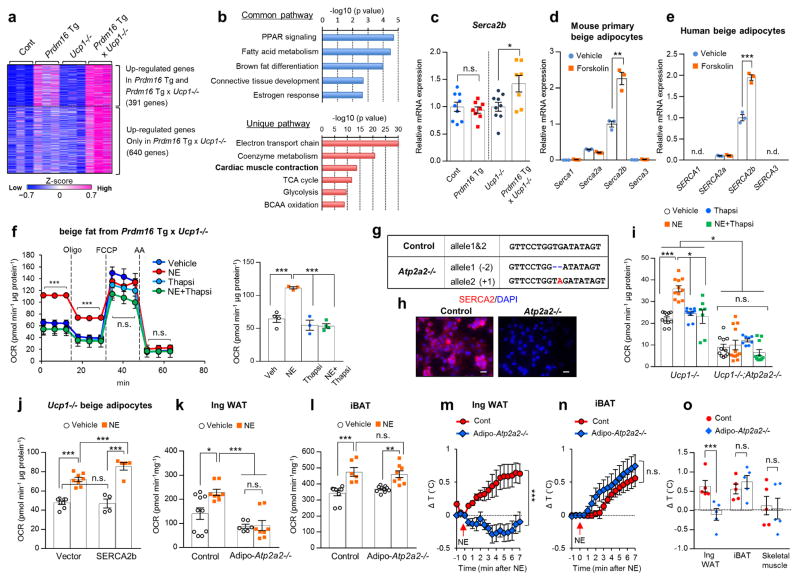
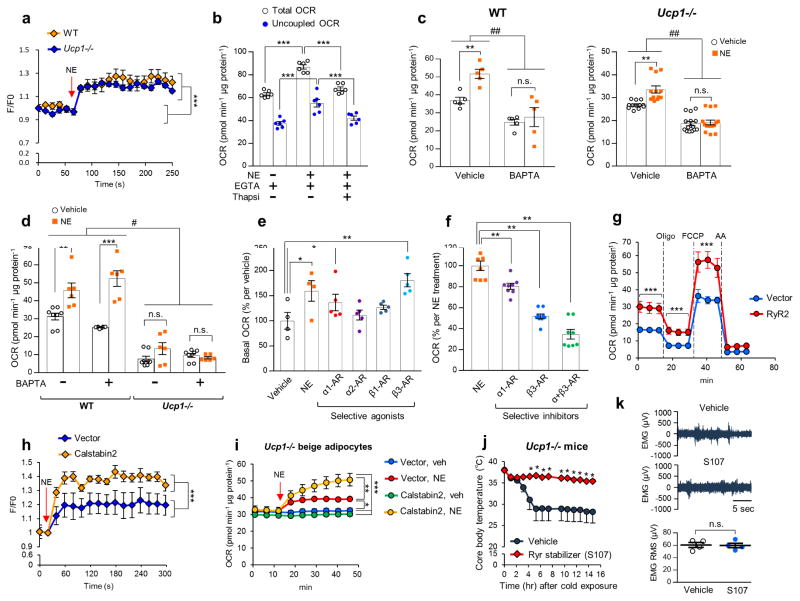
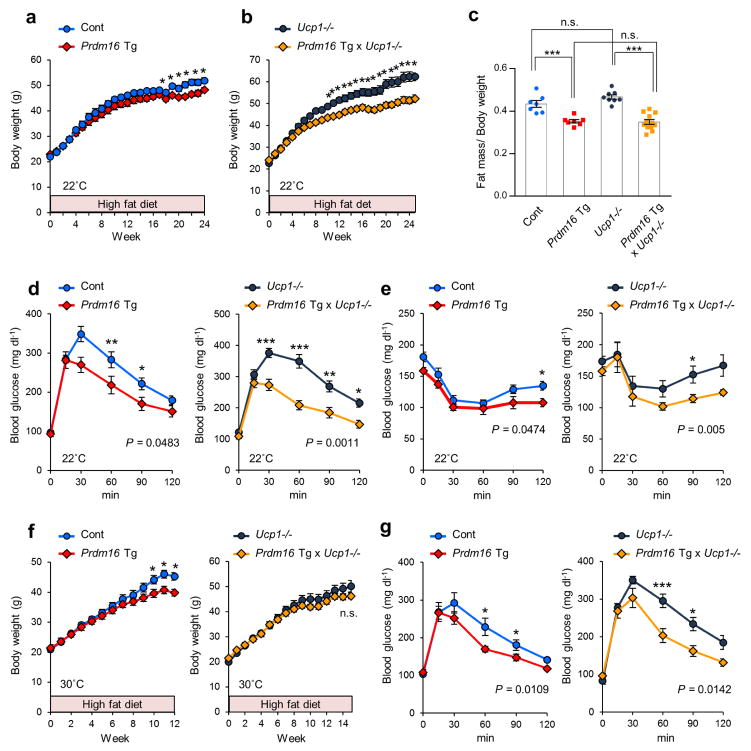
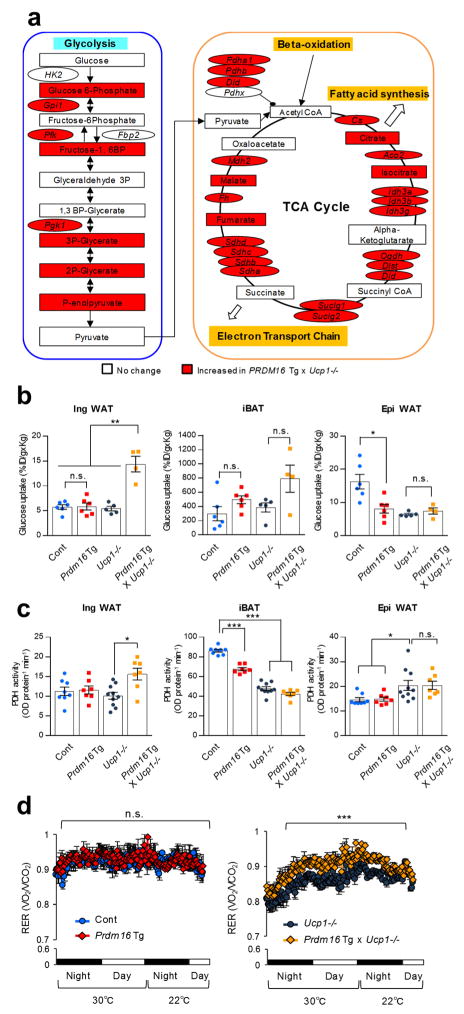
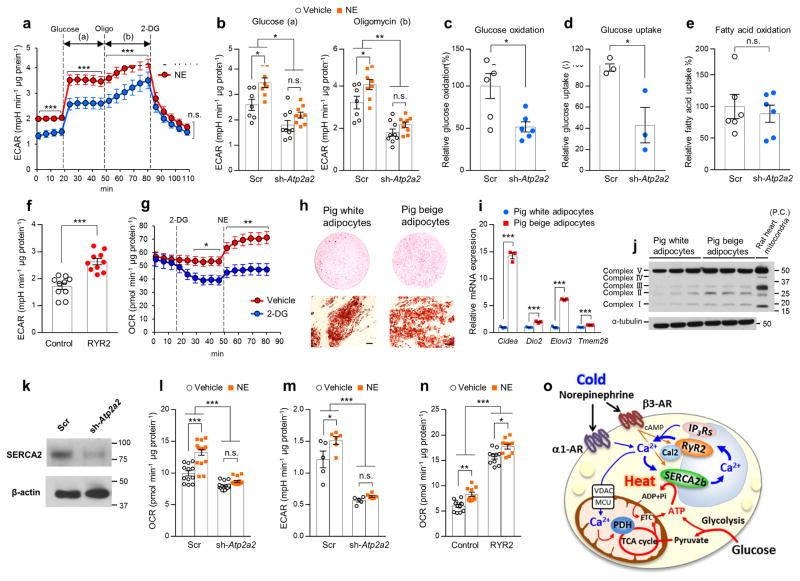
Uncoupling protein 1 (UCP1) plays a central role in nonshivering thermogenesis in brown fat; however, its role in beige fat remains unclear. Here we report a robust UCP1-independent thermogenic mechanism in beige fat that involves enhanced ATP-dependent Ca2+ cycling by sarco/endoplasmic reticulum Ca2+-ATPase 2b (SERCA2b) and ryanodine receptor 2 (RyR2). Inhibition of SERCA2b impairs UCP1-independent beige fat thermogenesis in humans and mice as well as in pigs, a species that lacks a functional UCP1 protein. Conversely, enhanced Ca2+ cycling by activation of α1- and/or β3-adrenergic receptors or the SERCA2b-RyR2 pathway stimulates UCP1-independent thermogenesis in beige adipocytes. In the absence of UCP1, beige fat dynamically expends glucose through enhanced glycolysis, tricarboxylic acid metabolism and pyruvate dehydrogenase activity for ATP-dependent thermogenesis through the SERCA2b pathway; beige fat thereby functions as a 'glucose sink' and improves glucose tolerance independently of body weight loss. Our study uncovers a noncanonical thermogenic mechanism through which beige fat controls whole-body energy homeostasis via Ca2+ cycling.


Conflict of interest statement

Competing Financial Interests

The authors declare no competitive financial interests.

Figures

Figure 1
Figure 1
UCP1 is dispensable for beige fat thermogenesis. (a) Rectal core body temperature of Prdm16 Tg and the littermate controls (Cont) under 6°C at indicated time points. n = 7 for both genotypes. *P < 0.05. (b) Rectal core body temperature of Prdm16 Tg x Ucp1−/− and the littermate Ucp1−/− mice under 6 °C. Ucp1−/− mice, n = 13; Prdm16 Tg x Ucp1−/−, n= 7. (c) Whole-body oxygen consumption rate (VO2) (left) and averaged VO2 ± s.e.m. (right) of Prdm16 Tg and the littermate controls following cold exposure at 6 °C. n = 5 for both groups. ***P < 0.001. (d) Whole-body heat generation (kcal) of the mice in c. ***P < 0.001. (e) Whole-body VO2 of Prdm16 Tg x Ucp1−/− and the littermate Ucp1−/− mice following cold exposure at 6 °C. n = 5 for both groups. ***P < 0.001. (f) Whole-body heat generation (kcal) of mice in e. ***P < 0.001. (g) Schematic diagram illustrating tissue temperature recording in the iBAT, the inguinal WAT, and the skeletal muscle. (h) Changes in tissue temperature (ΔT) in the indicated tissues following NE treatment (arrows) in the indicated groups of mice. Control (Cont), n = 6; Prdm16 Tg, n = 4; Ucp1−/−, n = 5; Prdm16 Tg x Ucp1−/−, n = 4. *P < 0.05, **P < 0.01, ***P < 0.001. n.s., not significant. (i) Representative EMG traces. n = 5 for both groups. (j) The quantification converted to the root mean square (RMS) (i) of Prdm16 Tg x Ucp1−/− and Ucp1−/− mice at 30°C and 6°C. n = 5 for both groups. *P < 0.05. Data in (a–f,h,j) are expressed as means ± s.e.m. Data analyzed by Student’s t-test (a,c–f,j) and ANOVA followed by Fisher’s LSD test (b) or Tukey’s test (h).
Figure 2
Figure 2
SERCA2b controls UCP1-independent thermogenesis in beige fat. (a) Hierarchical clustering and heat-map of RNA-sequence data in the inguinal WAT. n = 3 for all groups. The color scale shows z-scored FPKM representing the mRNA level of each gene in blue (low expression)-white-red (high expression) scheme. (b) The commonly up-regulated pathways in Prdm16 Tg mice and Prdm16 Tg x Ucp1−/− mice relative to their littermate controls (up) and the uniquely up-regulated pathways in Prdm16 Tg x Ucp1−/− mice relative to other genotypes (bottom). P values were shown on the top. n = 3 for all groups. (c) mRNA expression of Serca2b in the inguinal WAT. Control, n = 9; Prdm16 Tg, n = 8; Ucp1−/−, n = 9; Prdm16 Tg x Ucp1−/−, n = 7. *P < 0.05. n.s., not significant. (d) mRNA expression of indicated genes in differentiated mouse primary beige adipocytes treated with forskolin or vehicle. n = 3 for both groups. **P < 0.01. (e) mRNA expression of indicated genes in differentiated human beige adipocytes treated with forskolin or vehicle. n = 3 for both groups. ***P < 0.001. n.d., not detected. (f) OCR in Ucp1−/− beige adipocytes treated with vehicle, norepinephrine (NE), thapsigargin (thapsi), or NE plus thapsigargin. Oligomycin (Oligo), FCCP, and antimycin (AA) were added at indicated time points (left) and averaged basal OCR ± s.e.m (right). Vehicle, n = 4; NE, n = 3; Thapsi, n = 3; NE+Thapsi, n = 4. ***P < 0.001. (g) Genomic sequences of a clonal Ucp1−/− beige adipocyte line carrying the homozygous mutations in Atp2a2 by the CRISPR-Cas9 system (Atp2a2−/−). Mutations (red, insertion; -, deletion) and wild-type allele sequences (control) are shown. (h) SERCA2 immunohistochemistry in differentiated clonal Ucp1−/− beige adipocytes with homozygous mutations in Atp2a2−/− or control cells expressing a scrambled guide RNA. DAPI (blue) was used for nuclear staining. Scale bar= 25 μm. (i) Basal OCR in Ucp1−/− beige adipocytes expressing a control guide RNA (Ucp1−/−) and Atp2a2−/−;Ucp1−/− beige adipocytes. Ucp1−/− with vehicle and NE, n = 11 each; Ucp1−/− with Thapsi, n = 10; Ucp1−/− with NE+Thapsi, n = 7; Atp2a2−/−;Ucp1−/− with vehicle, n = 11; Atp2a2−/−;Ucp1−/− with NE, n = 12; Atp2a2−/−;Ucp1−/− with Thapsi, n = 8; Atp2a2−/−;Ucp1−/− with NE+Thapsi, n = 11. *P < 0.05, ***P < 0.001. (j) Basal OCR in Ucp1−/− beige adipocytes expressing SERCA2b or an empty vector. Differentiated cells were treated with vehicle or NE for one hour. Control with vehicle and NE, n = 8 for both; SERCA2b with vehicle, n = 4; SERCA2b with NE, n = 5. ***P < 0.001. (k) OCR in the inguinal WAT of control and fat-specific Atp2a2−/− mice after tissue isolation and treatment with NE or vehicle for one hour. Control with vehicle, n = 10; with NE, n = 8; Adipo-Atp2a2−/− with vehicle, n = 6; with NE, n = 8. *P < 0.05, ***P < 0.001. (l) OCR in the iBAT of control and fat-specific Atp2a2−/− mice. Control with vehicle, n = 10; with NE, n = 6; Adipo-Atp2a2−/− with vehicle, n = 10; with NE, n = 8. **P < 0.01, ***P < 0.001. (m) Real-time changes in tissue temperature (ΔT) in the inguinal WAT of control and Adipo-Atp2a2−/− mice following norepinephrine (NE) treatment. n = 5 for both groups. ***P < 0.001. (n) Real-time changes in tissue temperature (ΔT) in the iBAT of mice in (m). (o) Quantification in tissues temperature change (ΔT) in the indicated tissues of mice in (m). ***P < 0.001. Data in (c–f,i–o) are expressed as means ± s.e.m. Data analyzed by Student’s t-test (c–e,m–o) and ANOVA followed by Tukey’s test (f,i–l).
Figure 3
Figure 3
Enhanced Ca2+ cycling stimulates UCP1-independent thermogenesis in beige fat. (a) Intracellular Ca2+ levels in differentiated beige adipocytes from wild-type (WT) and Ucp1−/−mice following NE treatment (arrow). n = 6 for all groups. ***P < 0.001 by NE treatment. (b) Basal and oligomycin-resistant (uncoupled) OCR in Ucp1−/− beige adipocytes in a Ca2+ depleted medium containing EGTA in the presence of NE or thapsigargin (Thapsi). n = 6 for all groups. ***P < 0.001. (c) Basal OCR in WT and Ucp1−/− beige adipocytes treated with BAPTA or vehicle. WT cells, n = 5 for all the treatment; Ucp1 −/− with vehicle or NE, n = 12; Ucp1−/− with BAPTA or BAPTA+NE, n = 15. **P < 0.01 between vehicle and NE, ##P < 0.01 between vehicle and BAPTA. n.s., not significant. (d) Basal OCR in WT and Ucp1−/− brown adipocytes incubated in a medium containing BAPTA or vehicle. WT with vehicle, n = 8; WT with NE, n = 6; WT with BAPTA, n = 8; WT with BAPTA+NE, n = 6; Ucp1−/− with vehicle n = 8; Ucp1−/− with NE, n = 6; Ucp1−/− with BAPTA, n = 8; Ucp1−/− with BAPTA+NE, n = 6. **P < 0.01, ***P < 0.01 between vehicle and NE, #P < 0.05 between WT and Ucp1−/−. (e) Basal OCR in Ucp1−/− beige adipocytes treated with NE or specific agonists for α1-AR (phenylephrine), α2-AR (clonidine), β1-AR (denopamine), and β3-AR (CL316243). Vehicle and NE, n = 4; phenylephrine, n = 5; clonidine, n = 5; denopamine, n = 5; CL316243, n = 5. *P < 0.05, **P < 0.01 relative to vehicle. (f) OCR in Ucp1−/− beige adipocytes treated with specific inhibitors for α1-R (phenoxybenzamine) and β3-AR (SR59230A) in the presence of NE. NE, n = 8; phenoxybenzamine, n = 8; SR59230A, n = 9; phenoxybenzamine+SR59230A, n = 8. **P < 0.01. (g) OCR in Ucp1−/− beige adipocytes expressing RyR2 or an empty vector. Oligomycin (Oligo), FCCP, and antimycin (AA) were added at indicated time points. n = 5 for all groups. ***P < 0.001. (h) NE-induced Ca2+ release in Ucp1−/− beige adipocytes expressing Calbstabin2 or an empty vector in a Ca2+ depleted medium. n = 5 for all groups. ***P < 0.001. (i) Basal OCR in Ucp1−/− beige adipocytes expressing Calbstabin2 or an empty vector. NE or vehicle was added at the indicated time point. Vector with vehicle n = 8; with NE, n = 5; Calstabin2 with vehicle and NE, n = 10 for both. *P < 0.05, **P < 0.01, ***P < 0.001. (j) Rectal core body temperature of Ucp1−/− mice treated with the RyR2 stabilizer S107 or vehicle under 6°C at indicated time points. Vehicle, n = 9; S107, n = 8. *P < 0.05. (k) Representative EMG traces of Ucp1−/− mice treated with vehicle or S107 under 6°C. n=4 for both groups. Data are expressed as means ± s.e.m. Data analyzed by Student’s t-test (a,g,h,j,k) and ANOVA followed by Tukey’s test (b–f,i).
Figure 4
Figure 4
UCP1-independent roles of beige fat in the regulation of body-weight and glucose metabolism in vivo. (a) Body-weight of Prdm16 Tg mice and the littermate controls under HFD at 22°C. n = 7 for both groups. *P < 0.05. (b) Body-weight of Prdm16 Tg x Ucp1−/− and the littermate Ucp1−/− mice under HFD at 22°C. Ucp1−/−, n = 8; Prdm16 Tg x Ucp1−/−, n = 12. *P < 0.05. (c) Adiposity (fat mass per body-weight) of mice at 18 weeks of HFD. Control, n = 7; Prdm16 Tg, n = 7; Ucp1−/−, n = 8; Prdm16 Tg x Ucp1−/−, n = 12. ***P < 0.001. n.s., not significant. (d) GTT in Prdm16 Tg and the littermate controls (left) and Prdm16 Tg x Ucp1−/− and the littermate Ucp1−/− mice (right) at 10 weeks of HFD at 22°C. Control, n = 9; Prdm16 Tg, n = 8; Ucp1−/−, n = 10; Prdm16 Tg x Ucp1−/−, n = 7. *P < 0.05, **P < 0.01, ***P < 0.001. (e) ITT in mice in (d) at 11 weeks of HFD. *P < 0.05. (f) Body-weight of Prdm16 Tg and the littermate controls (left) and Prdm16 Tg x Ucp1−/− and the littermate Ucp1−/− mice (right) under HFD at 30°C. Control, n = 9; Prdm16 Tg, n = 7; Ucp1−/−, n = 7; Prdm16 Tg x Ucp1−/−, n = 8. *P < 0.05. (g) GTT in Prdm16 Tg and the littermate controls (left) and Prdm16 Tg x Ucp1 −/− and the littermate Ucp1−/− mice (right) at 10 weeks of HFD under 30°C. Control, n = 9; Prdm16 Tg, n = 7; Ucp1−/−, n = 7; Prdm16 Tg x Ucp1−/−, n = 5. *P < 0.05, ***P < 0.001. Data are expressed as means ± s.e.m. Data analyzed by Student’s t-test (c) and ANOVA followed by Fisher’s LSD test (a,b,d–g).
Figure 5
Figure 5
Active glucose utilization in Ucp1−/− beige fat through enhanced glycolysis and TCA metabolism. (a) Enhanced metabolic pathways in the inguinal WAT of Prdm16 Tg x Ucp1−/− mice. Based on RNA-sequencing and metabolomics, up-regulated genes and metabolites in the inguinal WAT of Prdm16 Tg x Ucp1−/− mice are highlighted by red. n = 3 for all groups. (b) 18F-FDG uptake in the indicated tissues and groups of mice. Control (Cont), n = 6; Prdm16 Tg, n = 6; Ucp1−/−, n = 5; Prdm16 Tg x Ucp1−/−, n = 4. *P < 0.05, **P < 0.01. n.s., not significant. (c) PDH enzymatic activity in the indicated tissues and groups of mice. Control, n = 8; Prdm16 Tg, n = 7; Ucp1−/−, n = 10; Prdm16 Tg x Ucp1−/−, n = 7. *P < 0.05, ***P < 0.001. (d) Respiratory exchange ratio (RER, VO2/CO2) in mice under 30°C and 22°C. Mice were acclimated at 30°C for 5 days and moved to CLAMS. Control (Cont), n = 6; Prdm16 Tg, n = 5; Ucp1−/−, n = 6; Prdm16 Tg x Ucp1−/−, n = 6. ***P < 0.001. Data in (b–d) are expressed as means ± s.e.m. Data analyzed by Student’s t-test (a) and ANOVA followed by Tukey’s test (b,c) or Fisher’s LSD test (d).
Figure 6
Figure 6
The SERCA2-RyR2 pathway controls glucose utilization and thermogenesis in Ucp1−/− beige fat. (a) ECAR in Ucp1−/− beige adipocytes in the culture medium with low or high glucose concentrations. Glucose, oligomycin (Oligo), and 2-DG were added at indicated time points. Vehicle, n = 7; NE, n = 8. ***P < 0.001. (b) ECAR in Ucp1−/− beige adipocytes expressing a scrambled control RNA (Scr) or shRNA targeting Atp2a2 (sh-Atp2a2). Differentiated cells were treated with NE or vehicle in the culture medium with a high glucose concentration (a) and oligomycin (b). Scr with vehicle, n = 7; Scr with NE, n = 8; sh-Atp2a2with vehicle, n = 9; sh-Atp2a2 with NE, n = 9. *P < 0.05, **P < 0.01. (c) Glucose oxidation in Ucp1−/− beige adipocytes expressing a scrambled control RNA (Scr) or shRNA targeting Atp2a2 (sh-Atp2a2). n = 6 for both groups. *P < 0.05. (d) Glucose uptake in Ucp1−/− beige adipocytes expressing a scrambled control RNA (Scr) or shRNA targeting Atp2a2 (sh-Atp2a2). n = 3 for both groups. *P < 0.05. (e) Fatty acid oxidation in Ucp1−/− beige adipocytes expressing a scrambled control RNA (Scr) or shRNA targeting Atp2a2 (sh-Atp2a2). n = 6 for both groups. n.s., not significant. (f) ECAR in Ucp1−/− beige adipocytes expressing RyR2 or an empty vector (Control). n = 10 for both groups. ***P < 0.001. (g) OCR in Ucp1−/− beige adipocytes treated with 2-DG, NE, or oligomycin (Oligo) at indicated time points. Vehicle, n = 9; 2-DG, n = 10. *P < 0.05, **P < 0.01. (h) Oil-Red-O staining of differentiated pig adipocytes expressing PRDM16 (beige) and vector (white) at low magnification (top) and high magnification (bottom). Scale bars, 50 μm. (i) mRNA expression of the indicated beige fat-selective genes in differentiated pig adipocytes expressing PRDM16 (beige) and an empty vector (white). n = 3 for both groups. ***P < 0.001. (j) Mitochondrial OXPHOS proteins in differentiated pig adipocytes expressing PRDM16 (beige) and an empty vector (white). Tissue lysates from the rat heart were used as a positive control (P.C.). Immunoblot using the α-tublin antibody was shown as a loading control. Molecular weight (kDa) is shown on the right. (k) SERCA2 protein in differentiated pig beige adipocytes expressing a scrambled control RNA (Scr) or shRNA targeting Atp2a2. β-actin was shown as a loading control. (l) Basal OCR in pig beige adipocytes expressing a scrambled control RNA (Scr) or shRNA targeting Atp2a2. Scr with vehicle, n = 12; Scr with NE, n = 17; sh-Serca2 with vehicle, n = 15; sh-Serca2 with NE, n = 15. ***P < 0.001. (m) ECAR in pig beige adipocytes expressing a scrambled control RNA (Scr) or shRNA targeting Atp2a2. Scr with vehicle, n = 5; Scr with NE, n = 6; sh-Serca2 with vehicle, n = 5; sh-Serca2 with NE, n = 6. *P < 0.05, ***P < 0.001. (n) Basal OCR in pig beige adipocytes expressing RyR2 or an empty vector (Control). Control with vehicle, n = 12; Control with NE, RYR2 with vehicle, RYR2 with NE, n = 10. *P < 0.05, **P < 0.01, ***P < 0.001. (o) A proposed model of non-canonical thermogenesis in beige fat. A full explanation of the diagram is included in the Discussion section. The acronyms used in the diagram include adrenergic receptor (AR), sarco/endoplasmic reticulum Ca2+-ATPase2b (SERCA2b), ryanodine receptor 2 (RyR2), inositol 1,4,5-trisphosphate receptors (IP3Rs), calstabin2 (Cal2), voltage-dependent anion channel (VDAC), mitochondrial calcium uniporter (MCU), dehydrogenase (PDH), and mitochondrial electron transport chain (ETC). Data in (a–g,i,l–n) are expressed as means ± s.e.m. Data analyzed by Student’s t-test (a,c–g,i) and ANOVA followed by Tukey’s test (b,l–n).

Comment in

References

    1. Golozoubova V, et al. Only UCP1 can mediate adaptive nonshivering thermogenesis in the cold. FASEB J. 2001;15:2048–2050. - PubMed
    1. Nedergaard J, et al. UCP1: the only protein able to mediate adaptive non-shivering thermogenesis and metabolic inefficiency. Biochimica et biophysica acta. 2001;1504:82–106. - PubMed
    1. Kajimura S, Spiegelman BM, Seale P. Brown and Beige Fat: Physiological Roles beyond Heat Generation. Cell Metab. 2015;22:546–559. - PMC - PubMed
    1. Wu J, et al. Beige adipocytes are a distinct type of thermogenic fat cell in mouse and human. Cell. 2012;150:366–376. - PMC - PubMed
    1. Shabalina IG, et al. UCP1 in brite/beige adipose tissue mitochondria is functionally thermogenic. Cell reports. 2013;5:1196–1203. - PubMed