. 2017 Dec;23(12):1488-1498.
doi: 10.1038/nm.4437. Epub 2017 Nov 13.

Enhancing the precision of genetic lineage tracing using dual recombinases

Affiliations

Enhancing the precision of genetic lineage tracing using dual recombinases

Lingjuan He et al. Nat Med. 2017 Dec.

Abstract

The Cre-loxP recombination system is the most widely used technology for in vivo tracing of stem or progenitor cell lineages. The precision of this genetic system largely depends on the specificity of Cre recombinase expression in targeted stem or progenitor cells. However, Cre expression in nontargeted cell types can complicate the interpretation of lineage-tracing studies and has caused controversy in many previous studies. Here we describe a new genetic lineage tracing system that incorporates the Dre-rox recombination system to enhance the precision of conventional Cre-loxP-mediated lineage tracing. The Dre-rox system permits rigorous control of Cre-loxP recombination in lineage tracing, effectively circumventing potential uncertainty of the cell-type specificity of Cre expression. Using this new system we investigated two topics of recent debates-the contribution of c-Kit+ cardiac stem cells to cardiomyocytes in the heart and the contribution of Sox9+ hepatic progenitor cells to hepatocytes in the liver. By overcoming the technical hurdle of nonspecific Cre-loxP-mediated recombination, this new technology provides more precise analysis of cell lineage and fate decisions and facilitates the in vivo study of stem and progenitor cell plasticity in disease and regeneration.


Conflict of interest statement

The authors declare no competing financial interests.

Figures

Figure 1
Figure 1
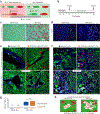
Generation and characterization of an interleaved reporter (IR1). (a) Schematic showing how Cre activity in unintended cell types confounds lineage tracing. In Cell A that expresses CreER, Cre-loxP recombination results in tdTomato expression when the mouse is treated with tamoxifen (“Pulse”). After a period of time (“Chase”), Cell B is found to express tdTomato. The conclusion that Cell B derives from Cell A is based on the absence of CreER expression in Cell B (scenario 1). Expression of CreER in Cell B, even at trace levels, may lead to Cre-loxP recombination in Cell B and labeling of Cell B, even if Cell A does not generate Cell B (scenario 2). As a result, unintended labeling of Cell B makes interpretation that Cell A gives rise to Cell B uncertain in scenario 2. (b) Recombination results, as assessed by tdTomato expression, for combinations of Cre and Dre drivers (ACTB-Cre and CAG-Dre) and rox and loxP reporters (R26-rox-tdTomato and R26-loxP-tdTomato) in E9.5 embryos. (c) Schematic showing how the IR1 reporter allele was generated by homologous recombination. DTA, diphtheria toxin; Neo, neomycin; pA, polyA sequence; Frt, Frt sequence as a substrate of Flp recombinase; WPRE, Woodchuck hepatitis virus posttranscriptional regulatory element. (d) Schematic diagram showing the result of Dre-rox or Cre-loxP recombination after crossing the IR1 mouse line with CAG-Dre or ACTB-Cre lines. (e) Whole mount bright-field and epifluorescent images showing ZsGreen and tdTomato staining in IR1, CAG-Dre;IR1 and ACTB-Cre;IR1 E19.5 embryos. (f) Immunostaining for ZsGreen and tdTomato in embryos as in e. DAPI was used as a nuclear stain. The location of the heart is indicated. Scale bars, 1 mm in b,e; 200 μm in f. Each figure is representative of 4 individual mouse samples.
Figure 2
Figure 2
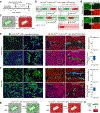
c-Kit+ non-cardiomyocytes do not generate cardiomyocytes. (a) Schematic showing the DeaLT-IR strategy for lineage tracing of c-Kit+ non-cardiomyocytes (ZsGreen+). See text for details. (b) Schematic showing the experimental timeline. After Tam administration, the mice were subjected to MI or no operation. (c,d) Whole-mount epifluorescence (c) and sectional staining for ZsGreen, TNNI3 and DAPI (d) in uninjured hearts from Kit-CreER;IR1 and Tnni3-Dre;Kit-CreER;IR1 mice. Magnification indicates white boxed region in images of left panel (d). YZ indicate signals from dotted lines on magnified Z-stack images. Arrowheads indicate cardiomyocytes. (e) Quantification of the percentage of ZsGreen+tdTomato cardiomyocytes. Conv., conventional strategy; New, new strategy. *P < 0.05; n = 4 per group. (f) Whole-mount fluorescence of infarcted hearts from Kit-CreER;IR1 and Tnni3-Dre;Kit-CreER;IR1 mice. Arrowheads indicate cardiomyocytes. (g) Fluorescence images of cardiomyocytes dissociated from Kit-CreER;IR1 (top) and Tnni3-Dre;Kit-CreER;IR1 hearts (bottom). Arrowheads indicate Kit-CreER labeled cardiomyocytes; arrows indicate Tnni3-Dre labeled cardiomyocytes. (h) Immunostaining for tdTomato, ZsGreen and TNNI3 in heart sections of the indicated mice. YZ indicates signals from Z-stack images along the orthogonal plane indicated by dotted lines. Arrowheads indicate a cardiomyocyte. (i) Quantification of the percentage of ZsGreen+tdTomato cardiomyocytes. *P < 0.05; n = 4 per group. (j) Immunostaining for tdTomato, ZsGreen and TNNI3 in a section from the heart of a Tnni3-Dre;Kit-CreER;IR1 mouse shows a tdTomato+ZsGreen+ cardiomyocyte (arrowhead), suggesting that cell fusion occurred between c-Kit+ cell (ZsGreen+) and cardiomyocyte (tdTomato+). (k) Schematic figure showing that c-Kit+ non-cardiomyocytes do not generate cardiomyocytes after injury. (l) Immunostaining for ZsGreen and CDH5 in sections from the hearts of the indicated mice. (m) Quantification of the percentage of ZsGreen+ endothelial cells. n.s., non-significant; n = 4 per group. Scale bars, 1 mm in c,f; 100 μm in d,g,h,j,l. Each figure is representative of 4 individual mouse samples.
Figure 3
Figure 3
Hepatocyte-to-ductal cell conversion uncovered by DeaLT-IR strategy. (a) Schematic showing tdTomato labeling of CK19+ biliary epithelial cells (BECs) by Dre-rox recombination. After tamoxifen induction, Alb+ hepatocytes but not BECs will be ZsGreen-labeled by Cre-loxP recombination. (b) Schematic showing the experimental timeline for cell labeling with Tam, injury by DDC treatment, and analysis. (c,d) Sirius red staining to assess fibrosis (c) and CK19 immunostaining to assess the ductal reaction (d) of liver sections of CK19-Dre;Alb-CreER;IR1 mice before and after injury. (e,f) Immunostaining for ZsGreen with tdTomato (top) or with CK19 (bottom) of liver sections from Alb-CreER;IR1 (conventional strategy) or CK19-Dre;Alb-CreER;IR1 (DeaLT-IR strategy) mice before (e) and after (f) injury. Alb-CreER labels hepatocytes but not BECs (arrows) before injury. After injury, a few ZsGreen+ cells (arrowheads) exhibit ductal cell-like morphology and express the BEC marker CK19. (g) Quantification of the percentage of ZsGreen+ BECs before and after injury, as determined using each of the two strategies. n = 4 per group. (h) Cartoon showing that a subset of new BECs (arrowhead) is derived from ZsGreen+ hepatocytes after injury. Scale bars, 200 μm in c; 100 μm in d-f. Each figure is representative of 4 individual mouse samples.
Figure 4
Figure 4
Generation and characterization of a secondary dual reporter system that uses nested recombinase sites. (a) Schematic showing the strategy for generation of the NR1 allele by homologous recombination. (b) Cartoon showing the pattern of cell labeling using the A-Cre;B-Dre;NR1 strategy. A+ cells express Cre under control of the A promoter; B+ cells express Dre under control of the B promoter; A+B+ cells express both Dre and Cre. This strategy labels A+ cells by ZsGreen, B+ cells by tdTomato, and A+B+ cells by tdTomato. (c) Schematic showing the strategy for crossing of CAG-Dre or ACTB-Cre mouse lines with the NR1 line. (d) Whole-mount bright-field and epifluorescence images of E13.5 NR1, CAG-Dre;NR1 and ACTB-Cre;NR1 embryos. (e) Immunostaining for tdTomato and ZsGreen on sections of embryos as in d. Scale bars, 1 mm. Each figure is representative of 4 individual mouse samples.
Figure 5
Figure 5
Sox9+ biliary epithelial cells adopt a ductal cell but not a hepatocyte fate after injury. (a) Schematic showing the experimental timeline for cell labeling with Tam, injury with CCl4, and analysis (b) Schematic showing the patterns of Cre- and Dre-mediated recombination in BECs and hepatocytes of Alb-DreER;Sox9-CreER;NR1 mice. (c) Cartoon showing the differences in how BECs and hepatocytes (Hep) are labeled by the conventional strategy (Sox9-CreER;NR1) and by the DeaLT-NR strategy (Alb-DreER;Sox9-CreER;NR1). (d) Whole-mount fluorescence for ZsGreen and tdTomato in liver before and after injury, using either the conventional or DeaLT-NR strategies. (e,f) Immunostaining for ZsGreen, tdTomato, CK19 and HNF4a before (e) or after (f) injury in sections of livers labeled by either the conventional (left) or DeaLT-NR (right) strategies. White arrowheads indicate BECs; yellow arrowheads indicate hepatocytes. Quantification of ZsGreen+ BECs or hepatocytes (Hep) is shown. n = 4 per group. (g) Cartoon showing the result of Sox9-CreER fate mapping by the two strategies. (h) Cartoon image showing that Sox9+ BECs do not generate new hepatocytes. Scale bars, 500 μm in d; 100 μm in e, f. Each figure is representative of 4 individual mouse samples.
Figure 6
Figure 6
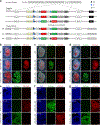
Generation and characterization of additional interleaved reporter alleles. (a) Schematic figure showing the knockin strategy for generation of the alleles IR2, IR3 and IR4 by homologous recombination. (b-d) Whole-mount bright-field and epifluorescence images of mouse lines bearing the IR2 (b), IR3 (c) and IR4 (d) reporter alleles; these lines were crossed with the ACTB-Cre or CAG-Dre lines, as indicated. Embryo ages are indicated. (e-g) Immunostaining for ZsGreen and tdTomato in sections of embryos as in b-d. Scale bars, 1 mm in b-d; 200 μm in e-g. Each image is representative of 3 individual embryonic samples.

References

    1. Laugwitz KL et al. Postnatal isl1+ cardioblasts enter fully differentiated cardiomyocyte lineages. Nature 433, 647–653 (2005). - PMC - PubMed
    1. Smart N et al. De novo cardiomyocytes from within the activated adult heart after injury. Nature 474, 640–644 (2011). - PMC - PubMed
    1. Chen Q et al. Endothelial cells are progenitors of cardiac pericytes and vascular smooth muscle cells. Nat Commun 7, 12422 (2016). - PMC - PubMed
    1. Kumar ME et al. Mesenchymal cells. Defining a mesenchymal progenitor niche at single-cell resolution. Science 346, 1258810 (2014). - PMC - PubMed
    1. Snippert HJ et al. Intestinal crypt homeostasis results from neutral competition between symmetrically dividing Lgr5 stem cells. Cell 143, 134–144 (2010). - PubMed

MeSH terms