. 2017 Dec;23(12):1424-1435.
doi: 10.1038/nm.4438. Epub 2017 Nov 13.

Human primary liver cancer-derived organoid cultures for disease modeling and drug screening

Affiliations

Human primary liver cancer-derived organoid cultures for disease modeling and drug screening

Laura Broutier et al. Nat Med. 2017 Dec.

Abstract

Human liver cancer research currently lacks in vitro models that can faithfully recapitulate the pathophysiology of the original tumor. We recently described a novel, near-physiological organoid culture system, wherein primary human healthy liver cells form long-term expanding organoids that retain liver tissue function and genetic stability. Here we extend this culture system to the propagation of primary liver cancer (PLC) organoids from three of the most common PLC subtypes: hepatocellular carcinoma (HCC), cholangiocarcinoma (CC) and combined HCC/CC (CHC) tumors. PLC-derived organoid cultures preserve the histological architecture, gene expression and genomic landscape of the original tumor, allowing for discrimination between different tumor tissues and subtypes, even after long-term expansion in culture in the same medium conditions. Xenograft studies demonstrate that the tumorogenic potential, histological features and metastatic properties of PLC-derived organoids are preserved in vivo. PLC-derived organoids are amenable for biomarker identification and drug-screening testing and led to the identification of the ERK inhibitor SCH772984 as a potential therapeutic agent for primary liver cancer. We thus demonstrate the wide-ranging biomedical utilities of PLC-derived organoid models in furthering the understanding of liver cancer biology and in developing personalized-medicine approaches for the disease.


Conflict of interest statement

Competing Financial Interests

The authors declare no competing financial interests.

Figures
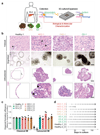
Figure 1
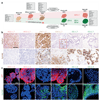
Figure 1. Patient-derived primary liver cancer organoid cultures expand long-term in vitro while preserving the histological architecture of the tumour subtype they derived from.
(a) Experimental design. Healthy (donor-derived) liver tissues, moderate/well differentiated hepatocellular carcinoma (HCC), combined hepatocellular-cholangiocarcinoma (CHC) and cholangiocarcinoma samples (CC) were obtained from patients undergoing surgery (patient’s information detailed in Supplementary Table 1) and were processed as described in Methods and Supplementary Fig. 1. (b) Representative H&E staining of healthy liver tissue and primary tumours (top row), and corresponding brightfield microscopy images (middle row) and H&E histological analysis of the organoid lines derived from these (bottom row). Note that, while healthy liver-derived organoids (left) grew as single layered epithelium of ductal-like cells surrounding a central lumen (*, duct; L, lumen), tumour-derived organoids (tumouroids; right) formed compacted structures that resembled the corresponding tumour-of-origin. HCC-1 tumouroids, like their parental tissue, exhibit pseudoglandular rosettes (arrowheads), a hallmark of HCC. CC-1 tumouroids present a glandular lumen, similar to the patient’s tumour (top row). Scale bars, middle row 100µm; top and bottom rows, 50µm. Brightfield and H&E pictures from other lines are provided in Supplementary Fig. 2. (c) Organoid formation efficiency in classical human healthy liver isolation medium24-25 and tumouroid specific isolation medium (classical human healthy liver isolation medium without Rspo-1, Noggin and Wnt3a and 3nM Dexamethasone - see methods and Supplementary Fig. 1 for details). Graph represents the mean±SD of the organoid formation efficiency in tumouroid IM relative to the one in classical IM. Individual data points are shown (circle). Significant differences between the classical and tumouroid IM groups were observed. **, p-value<0.001 (t-test, two-tailed). (d) Expansion potential of tumouroid cultures established and their correlation to the expansion of healthy-tissue derived organoids. Arrow, continuous expansion. Dot, passage.
Figure 2
Figure 2. Immunohistochemistry analyses reveal that the PLC tumouroids retain expression patterns of the distinct subtype of the original tissue they derived from, even after long-term expansion in culture.
(a) Schematic representation of the multiple subtypes of primary liver cancers (PLC). (b) IHC assays on the PLC tissues including hepatocyte/HCC marker (HepPar1) and ductal/CC marker (EpCAM). Scale bar, 125 μm. Dashed red square indicates focal staining. (c) Immunofluorescent analysis for the HCC marker AFP (red) and the ductal/CC marker EpCAM (green), on tumouroids expanded in culture for at least 3 months. Nuclei were counterstained with Hoechst33342 (blue). Scale bar, 30µm.
Figure 3
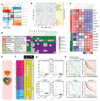
Figure 3. Tumouroids recapitulate the expression profiles of the specific tissue of origin.
(a) Correlation heat map between PLC-tissue (_T) and paired PLC-derived organoid line (_O) expression profiles’ after at least >2 months expansion in culture. (b) Principal component analysis (PCA) showing samples plotted in 2 dimensions using their projections onto the first two principal components (PC1 and PC2). Each data point represents one sample (circle, tumouroid; triangle, tissue). PC1 is strongly correlated with the type of sample (tumouroids vs tissue) whereas PC2 defines the 3 different PLC subtypes (HCC, red; CHC, brown; and CC, green). Representative examples from the top-100 genes with highest loadings across PC2 are shown. (c) Heat map analysis of the log2 RPKM values (raw z-scored) of selected genes found highly expressed (red) in HCC and/or CHC and/or CC tumouroids. Top left column indicates whether the indicated genes are markers of HCC/Hepatocyte/Fetal liver/CC/Ductal or liver progenitor markers. (d) Heat-map indicating representative gene-sets significantly (False discovery rate (FDR)<25%) UPregulated (purple) and DOWNregulated (green) in the tumouroid lines and paired tissues after performing gene set enrichment analysis (GSEA) comparing their gene signatures to 159 curated gene-sets associated with liver cancer and stem cell (representative plots are shown in Supplementary Fig. 5). Full list of gene-sets and significantly enriched gene-sets can be found in Supplementary Dataset 2 and 3. (e) Schematic of the tumouroid signature. Venn diagram overlapping the upregulated genes in each tumouroid line compared to healthy organoids. (f) Table summarizing the results of the gene expression (OE, overexpression) and outcome prediction (KM, Kaplan-Meier) analyses for the top 25-genes of the tumouroid signature using publically available TCGA cohorts. The table details the p-values obtained (OE, two-sided t-test ; KM, log-rank test). Statistical significance (p-value≤0.05) is denoted by yellow color. Values for the top 30-genes can be found in Supplementary Dataset 1. TCGA-HCC, 374 tumour/50 normal samples; TCGA-CC, 31 tumour/8 normal samples. (g) Expression of STMN1, C1QBP and C19orf48 in tumour and normal tissues in the TCGA-HCC and/or CC cohorts. Center line, median; box plot, interquartile range (IQR); whiskers, range (minimum to maximum). (h) Kaplan-Meier analyses of the TCGA-HCC and/or TCGA-CC cohorts based on the expression level of the indicated genes in the cohorts samples.
Figure 4
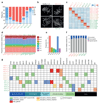
Figure 4. Tumouroids preserve the genetic alterations from the original tumour
(a) Ploidy analysis of tumouroid cultures expanded for at least 2 months in culture. Results are expressed as % of ploidy per number of metaphases counted (at least 21 total). Healthy-derived organoids were used as control. A minimum of two independent experiments were performed. (b) Representative images of organoid metaphases used for the ploidy analysis. Scale bar, 10µm. (c-e) Whole exome sequencing analysis of patient's tumour tissues and corresponding tumouroid cultures expanded for < 2 months (early passage) or >4 months (late passage) in culture. All variants identified in all samples (21 total; 7 patients with 3 samples each (Tissue/early organoid/late organoid) were used for the global analyses after filtering for quality control as detailed in methods). (c) Correlation heat-map between the variants identified in PLC-tissues (_T) and PLC-tumouroids (_O). (d) Proportions of exonic variants across the samples, the 6 types of SNVs and the Indels are represented. (e) Percentage of the 6 types of SNVs averaged across all samples. Graph represents mean±SD. (f-g) A cancer-related set of variants (f) and variants predicted to impair protein function (SIFT score <0.05 filter) (g) were identified as described in methods. (f) Bar plots indicate the concordance (%) between the cancer-related variants identified in the tumour-of-origin and the corresponding tumouroids expanded for short term in culture. (g) Damaging coding mutations found in genes already described mutated in liver cancer (Full list is found in Supplementary Dataset 4, spread sheet 15 details the references). The type of mutation is indicated in the legend. _T, tissue; _O, organoid.
Figure 5
Figure 5. In vivo growth and metastatic potential of PLC tumouroids
(a) Experimental design. PLC tumouroids or Healthy liver-derived organoids expanded for >3 months in culture were transplanted subcutaneously (SC) or under the kidney capsule (Kid.Cap.) of immunocompromised NSG mice and analysed for the presence of tumour growth and metastasis following grafting. (b) Tables summarizing the number of cells, site of engraftment and analysis of tumour and lung metastasis. No tumour lesions were found in any of the mice injected with Healthy-1 organoids. (c-d) Representative H&E staining of CC-1 (c) and HCC-1 (d) tumouroids transplanted subcutaneously (top) into NSG mice and corresponding patient’s tumour sample (bottom). (c) Note that the grafted CC-1 tumouroid tissue (top) recapitulates the histo-architecture of the patient’s original tumour (bottom) including the extensive desmoplastic reaction (arrowheads). Scale bars, left 125µm, right 62.5µm. (d) Note that the grafted HCC-1 tumouroid tissue recapitulates the histo-architecture of the patient’s original tumour (bottom) including the pseudoglandullar rosettes, hallmark of HCC-1 original sample (dashed circle). Scale bars, left 125µm, right 62.5µm. (e) Representative H&E (left) and KRT19 (right) immunohistochemistry analyses of CC-1 tumouroids transplanted under the kidney capsule of NSG mice. Scale bar, 125µm. (f) Lung metastases derived from CC-1 tumouroids transplanted under the kidney capsule (right panels) were identified using a human specific KRT19 antibody. No metastases were found in the lungs of mice injected with Healthy-1 organoids (left panels). Scale bars, 500µm, magnifications 125µm.
Figure 6
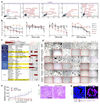
Figure 6. PLC tumouroid lines as a platform for drug screening and validation of actionable therapeutic targets.
(a) Scatterplot of 1-AUC (Area Under the Curve) values from two biological replicates (different passages) of the drug screening data, highlighting drugs (red) having a potential effect on viability (AUC >0.15 for at least 1 of the two replicates) in the indicated tumouroid lines. Each data point is the 1-AUC value for a given drug in a particular tumouroid line. (b) Dose-response curves after 6 days treatment with Gemcitabine, Nutlin-3a, LGK974 and SCH772984 generated from the luminescent signal intensities. Data displayed are average of the technical and biological replicates. (c) Summary of the different compounds used in the drug screening, the associated pathway and nominal targets and the screen results represented as a summary of the 1-AUC and IC50 data generated for the different tumouroid lines. Red, IC50 within the screen concentration range (detailed in methods); Dense dotted pattern, 1-AUC>0.15 and dose response; scattered dotted pattern, 1-AUC>0.15 and sensitivity at highest concentration only (Supplementary Dataset 5). Compounds highlighted in yellow were selected for further validation. (d) Effects on viability of indicated compounds using an organoid formation assay (detailed in methods). Red square, no viable cells; orange square, intermediate sensitivity; no square, resistant. Scale bar, 500μm. (e) In vivo activity of the ERKi (SCH772984) in CC-1_O tumouroids grafted subcutaneously in NSG mice. Mice were treated with drug/vehicle twice daily for 20 days (n=5 in 2mg/kg of SCH772984 group, n=8 in vehicle group). *, p-value<0.01; **, p-value<0.002 (Mann Whitney test, two-tailed). Results are shown as percentage of the tumour volume relative to day 0 (mean ±SD). (f-g) Histological analysis of the antitumor efficacy of SCH772984 on CC-1_O tumours was assessed 24 days after starting the treatment. Representative (f) H&E and (g) TUNEL staining performed on tissue sections from CC-1_O tumours treated with either vehicle (left) or SCH772984 (right). Representative images from 2 independent experiments are shown. Scale bar, 125μm (H&E) and 25μm (TUNEL).

Comment in

References

    1. Bosch FX, Ribes J, Díaz M, Cléries R. Primary liver cancer: Worldwide incidence and trends. Gastroenterology. 2004;127:S5–S16. - PubMed
    1. Bridgewater J et al. Guidelines for the diagnosis and management of intrahepatic cholangiocarcinoma. Journal of Hepatology. 2014;60:1268–1289. - PubMed
    1. Hirohashi S, et al. Tumours of the Liver and Intrahepatic Bile Ducts. In: Stanley R, Hamilton MD, Lauri A, Aaltonen MD PhD, editors. World Health Organization Classification of Tumours. IARCPress; 69372 Lyon France: 2000.
    1. Lee SD, et al. Clinicopathological features and prognosis of combined hepatocellular carcinoma and cholangiocarcinoma after surgery. Hepatobiliary Pancreat Dis Int. 2014;13:594–601. - PubMed
    1. International Consensus Group for Hepatocellular, N Pathologic diagnosis of early hepatocellular carcinoma: A report of the international consensus group for hepatocellular neoplasia. Hepatology. 2009;49:658–664. - PubMed

MeSH terms

Substances