. 2018 Jan;15(1):81-89.
doi: 10.1038/nmeth.4502. Epub 2017 Nov 13.

An improved MS2 system for accurate reporting of the mRNA life cycle

Affiliations

An improved MS2 system for accurate reporting of the mRNA life cycle

Evelina Tutucci et al. Nat Methods. 2018 Jan.

Abstract

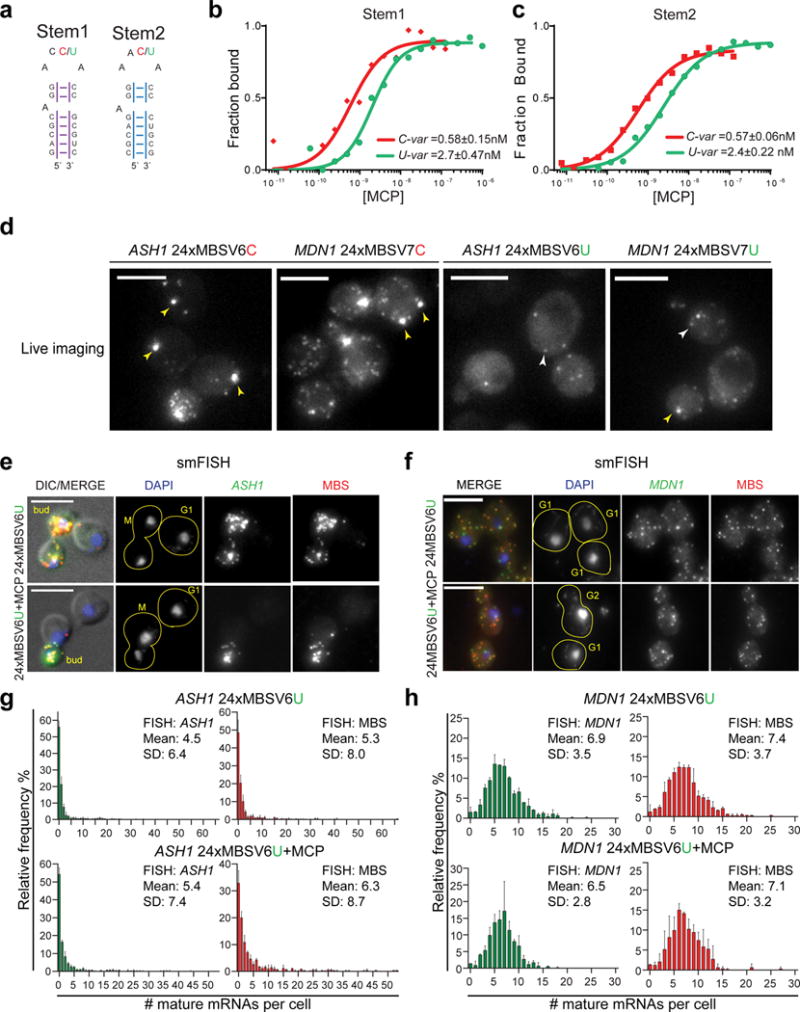
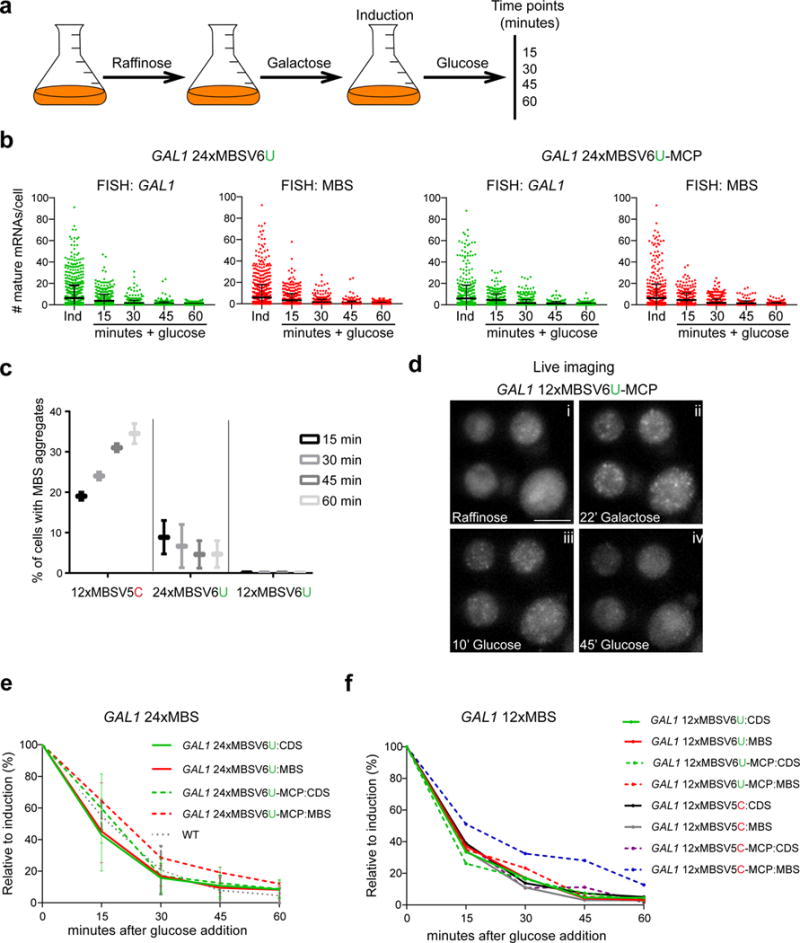
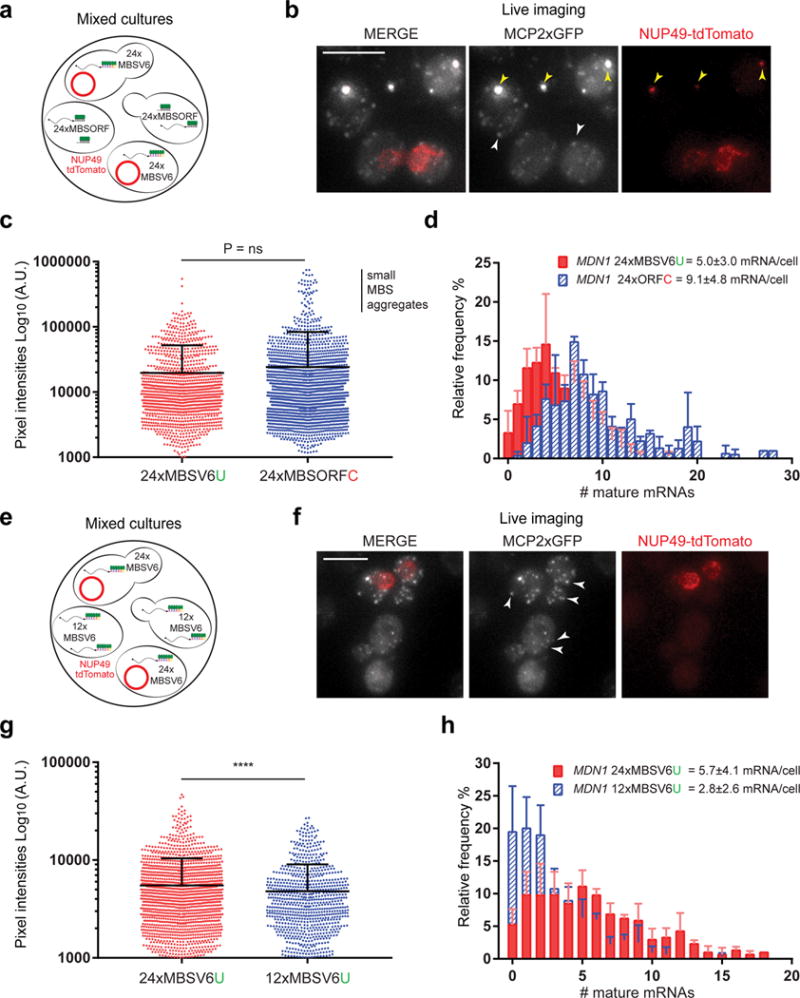
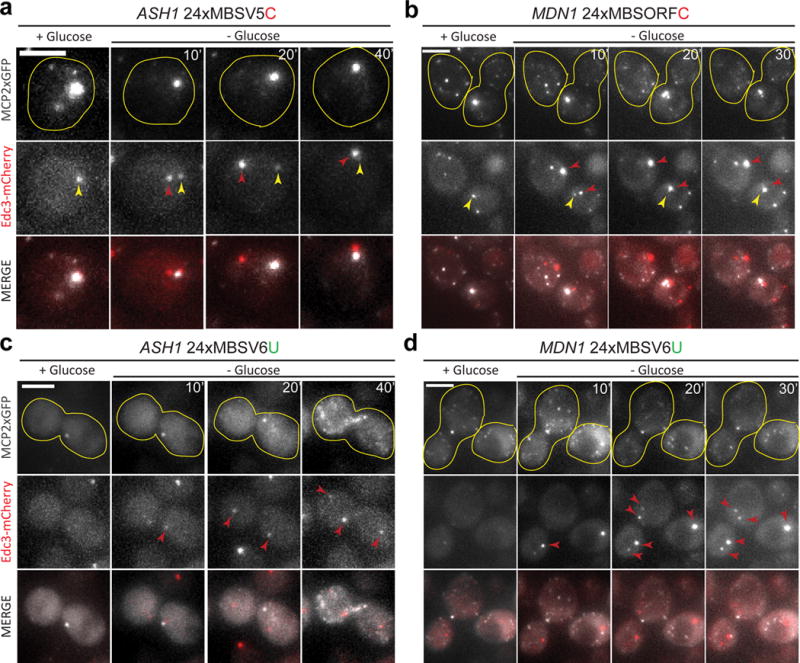
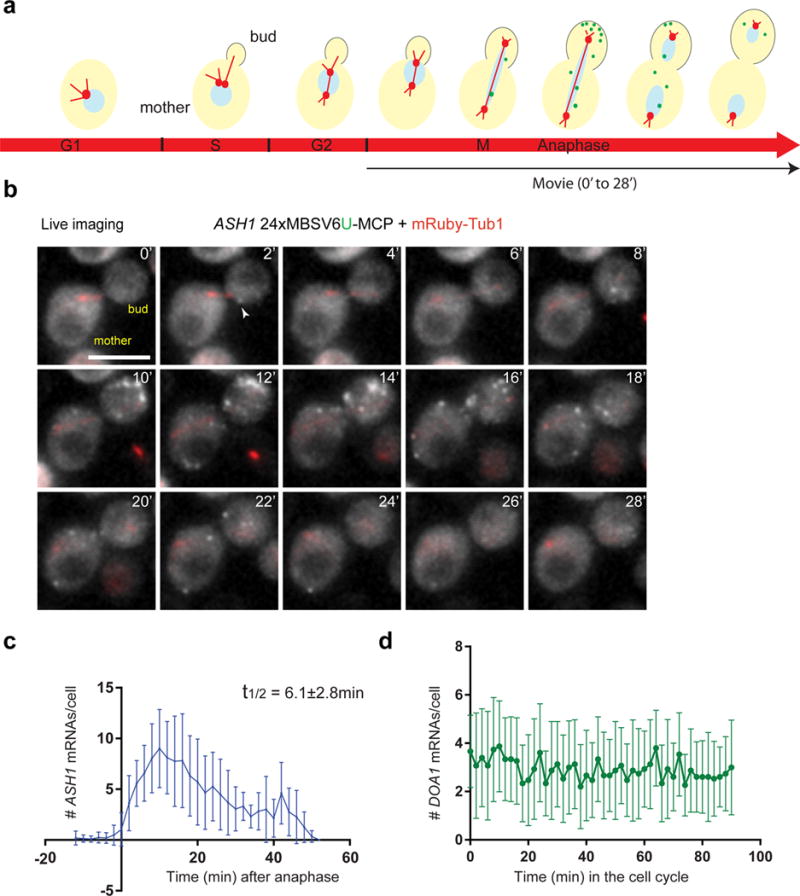
The MS2-MCP system enables researchers to image multiple steps of the mRNA life cycle with high temporal and spatial resolution. However, for short-lived mRNAs, the tight binding of the MS2 coat protein (MCP) to the MS2 binding sites (MBS) protects the RNA from being efficiently degraded, and this confounds the study of mRNA regulation. Here, we describe a reporter system (MBSV6) with reduced affinity for the MCP, which allows mRNA degradation while preserving single-molecule detection determined by single-molecule FISH (smFISH) or live imaging. Constitutive mRNAs (MDN1 and DOA1) and highly-regulated mRNAs (GAL1 and ASH1) endogenously tagged with MBSV6 in Saccharomyces cerevisiae degrade normally. As a result, short-lived mRNAs were imaged throughout their complete life cycle. The MBSV6 reporter revealed that, in contrast to previous findings, coordinated recruitment of mRNAs at specialized structures such as P-bodies during stress did not occur, and mRNA degradation was heterogeneously distributed in the cytoplasm.


Conflict of interest statement

Competing Financial Interest

The material in this manuscript is the subject of a provisional application to the US Patent and Trademark Office. It has not been licensed to any corporation, and the authors (E.T, M.V. and R.H.S) are the sole inventors.

Figures

Figure 1
Figure 1. Current MBS systems resist degradation in yeast
(a, b) Scheme of ASH1 and MDN1 loci tagged currently used MBS. (a) 24xMBSV5 inserted in the 3′UTR of endogenous ASH1 gene. Purple boxes = localization sequences of ASH1 mRNA. (b) 24xMBSORF inserted in the 3`UTR of the endogenous MDN1 gene. (a, b) Dotted lines designate smFISH probe positions recognizing the CDS (green) or MBS sequences (red). (c, d) Two color smFISH for (c) ASH1 mRNA tagged with 24xMBSV5 and (d) MDN1 mRNA tagged with 24xMBSORF, in cells expressing MCP (YcpLac111 CYC1p-MCP-NLS-2xyeGFP) or the vector alone (YcpLac111). (c) DIC/MERGE shows the overlap of the DAPI signal in the nucleus (blue), smFISH for the ASH1 CDS (green) and the MBS (red) with the differential interference contrast (DIC) image. (d) MERGE shows the overlap of the DAPI (blue), smFISH for the MDN1 CDS (green) and the MBS (red). Yellow lines define the shape of a single cell (the bud position is indicated for the ASH1 expressing cells). For each cell is indicated the stage of the cell cycle (G1, S, G2 and M phase). White arrows =single mRNAs, green arrows = transcription sites, yellow arrows = MBS aggregates. Scale bar = 5μm. (e,f) Quantification of smFISH represented in 1c and 1d with CDS probes (green plots) or MBS probes (red plots) reported as frequency distribution of mature (e) ASH1 and (f) MDN1 mRNAs per cell. Mean and SD of two independent cell cultures, n = ~500 cells per experiment, distribution of the mRNAs was generated using the same binning. (g) MBS aggregates in the cytoplasm are detected as bright fluorescent spots by smFISH. The percentage indicates cells positive for MBS aggregates. Yellow arrows = MBS aggregates. Scale bar = 5μm. (h) MBS aggregates are detected in the cytoplasm of living cells co-expressing MCP. (White arrows = single ASH1 (left) and MDN1 (right) mRNAs. Yellow arrows = MBS aggregates. Scale bar = 5μm.
Figure 2
Figure 2. Design and characterization of a new MS2-MCP system
(a) RNA stem loop sequences used for EMSA assays. Stem1 and Stem2 have randomized stem sequence of 7 nts. The two loops were synthetized either as an U-variant or C-variant at position −5. The affinity of MCP for the two stem loops was tested by EMSA. (b, c) Binding affinity of MCP for the MBS C-variants and U-variants. The Kd from three independent measurements (Figure Supplementary 2f-g) is indicated on the plots for (b) Stem1 and (c) the Stem2, either U or C-variant. (d) Image of living cells co-expressing MCP. (Left) ASH1 24xMBSV6 C-variant or MDN1 24xMBSV7 C-variant. (Right) ASH1 24xMBSV6 U-variant or MDN1 24xMBSV7 U-variant. Yellow arrows = MBS aggregates. White arrows = single mRNAs. Scale bar = 5μm. (e, f) Two color smFISH for (e) ASH1 mRNAs and (f) MDN1 mRNAs tagged with 24xMBSV6, in cells expressing MCP or the vector alone. (e) DIC/MERGE shows the overlap of the DAPI (blue), smFISH for the ASH1 CDS (green) and the MBSV6 (red) with the DIC image. (f) MERGE shows the overlap of the DAPI signal (blue), smFISH for the MDN1 CDS (green) and the MBSV6 (red). Yellow lines define the shape of a single cell. For each cell is indicated the cell cycle stage. Scale bar = 5μm. (g, h) Quantification of smFISH represented in 2e and 2f with CDS probes (green plots) or MBS probes (red plots) reported as frequency distribution of mature (g) ASH1 and (h) MDN1 mRNAs per cell. Mean and SD of independent cell cultures, n =~500 cells per experiment.
Figure 3
Figure 3. 12xMBSV6 faithfully reports the rapid degradation of GAL1 mRNA
(a) Scheme of protocol used to control GAL1 mRNA expression. (b) Quantification of smFISH for GAL1 24xMBSV6 mRNAs in cells expressing left: vector alone or right: MCP. Each dot represents the quantification obtained from a single cell with probes binding the CDS (green) or the MBSV6 (red). Error bars indicate the Mean and SD from three independent cell cultures. (c) Percentage of cells with MBS aggregates derived from the degradation of GAL1 mRNA tagged with the current and new MBS systems at different times after glucose addition. Mean and SD from two independent cell cultures. MBS aggregates were not detected for cells co-expressing GAL1 12xMBSV6 and MCP. (d) Representative images of Supplementary Video1 of GAL1 12xMBSV6-MCP. Time indicates the minutes cells were shifted from raffinose (i) to galactose (ii) and then to glucose (iii, iv). (e) Plots of GAL1 mRNA decay obtained from the quantification described in 2b. The mean number of mRNAs at each time point was normalized to the induced condition (100%) and reported as a percentage. WT indicates the quantifications of smFISH performed with GAL1 CDS probes on an untagged (wt) strain. Non significantly differences between the half-life measured with the CDS or MBS probes (paired t test, P values are reported in Supplementary Table 2). Mean and SD are calculated from three independent cultures. (f) Plots of GAL1 mRNA decay tagged with 12xMBSV5 or V6. The mean number of mRNAs at each time point was normalized to the induced condition (100%) and reported as a percentage. The plots represent one experiment out of two independent cell cultures.
Figure 4
Figure 4. MBSV6-MCP maintains single mRNA resolution in living cells
(a) Scheme of the mixed cultures used to compare the intensity of single MDN1 mRNAs tagged with either 24xMBSV6 or 24xMBSORF. Cells expressing 24xMBSV6-MCP co-express Nup49-tdTomato marking the nuclear envelope (red circle). (b) Two color live imaging of the mixed cultures. MERGE shows the mRNA signal (gray) and Nup49tdTomato (red). Yellow arrows = MBS aggregates containing GFP that “bleed through” the red channel. White arrows = single mRNAs. (c) Plot of the intensities of single MDN1 mRNAs tagged with either 24xMBSV6 (n= 1246) or 24xMBSORF (n=2271). Note higher intensities of small aggregates, cells with large aggregates visible in the red channel were excluded. Mean and SD of three independent cultures, n = ~100 cells per experiment. Non-parametric Mann-Whitney test does not show significant difference in brightness between 24xMBSV6 or 24xMBSORF populations, P= 0.6753. (d) Frequency distribution of MDN1 mRNAs per cell tagged with either 24xMBSV6 or 24xMBSORF. Single mRNA molecules counted from sample in 4b. Mean and SD of three independent cultures, n= ~100 cells per experiment. (e) Scheme of the mixed cultures to compare the intensity of single MDN1 mRNAs tagged with either 24xMBSV6 or 12xMBSV6. Cells expressing 24xMBSV6-MCP co-express Nup49-tdTomato marking the nuclear envelope (red circle). (f) Two color live imaging of the mixed cultures. MERGE shows the mRNA signal (gray) and Nup49tdTomato (red). White arrows = single mRNAs. (g) Plot of the intensities of single MDN1 mRNAs tagged with either 24xMBSV6 (n= 1684) or 12xMBSV6 (n=861). Mean and SD of three independent cultures, n = ~100 cells per experiment. Non-parametric Mann-Whitney test shows significant difference in brightness between 24xMBSV6 or 12xMBSV6 populations, P <0.0001. (h) Frequency distribution of MDN1 mRNAs per cell tagged with either 24xMBSV6 (red) or 12MBSV6 (blue). Single mRNA molecules counted from sample in 4f. Mean and SD of three independent cultures, n= ~100 cells per experiment.
Figure 5
Figure 5. MBSV6-MCP enables single mRNA imaging under stress conditions
(a–d) Live imaging of mRNAs tagged with 24xMBS-MCP in cells expressing the PB marker Edc3-mCherry. (a, c) ASH1 mRNAs tagged with either 24xMBSV5-MCP or 24xMBSV6-MCP. (b, d) MDN1 mRNAs tagged with either 24xMBSORF-MCP or 24xMBSV6-MCP. MERGE indicates the overlap between the mRNA signal (gray) and Edc3-mCherry signal (red). Yellow lines define the shape of a single cell. Yellow arrows = “bleed through” from MBS aggregates. Red arrows = PBs. Representative images from Supplementary Videos 2 and 3. Time after glucose starvation (left to right, intervals in min). Scale bar = 3μm.
Figure 6
Figure 6. MBSV6-MCP quantitatively reports ASH1 mRNA levels throughout the cell cycle
(a) Scheme of ASH1 mRNA expression during the cell cycle (marked on red arrow). Green dots represent ASH1 mRNA. mRubyTub1 (red) marks the spindle pole body, duplicated during S phase. The bud emergence (outlined) starts during S-phase and ends with the formation of the daughter cell. The black arrow indicates the corresponding cell cycle phase of the Video in Figure 6b. (b) Representative images of Supplementary Video 4. Simultaneous two-color imaging of cells co-expressing ASH1 24xMBSV6-MCP (gray) and mRubyTub1 (red). Time 0 indicates the beginning of anaphase. Images were acquired every 2 minutes. White arrows = single mRNAs. Scale bar = 5μm. (c) Quantification of single ASH1 mRNAs during the cell cycle. Time 0 indicates the beginning of anaphase (n= 21). During mitosis, ASH1 decayed with a t1/2 of 6.1±2.8 min. (d) Quantification of single DOA1 mRNAs tagged with 24xMBSV6-MCP during the complete cell cycle (n=15). Images were acquired every 2 minutes (Supplementary Video 4).

References

    1. Vera M, Biswas J, Senecal A, Singer RH, Park HY. Single-Cell and Single-Molecule Analysis of Gene Expression Regulation. Annual review of genetics. 2016;50:267–291. doi: 10.1146/annurev-genet-120215-034854. - DOI - PMC - PubMed
    1. Bernardi A, Spahr PF. Nucleotide sequence at the binding site for coat protein on RNA of bacteriophage R17. Proceedings of the National Academy of Sciences of the United States of America. 1972;69:3033–3037. - PMC - PubMed
    1. Bertrand E, et al. Localization of ASH1 mRNA particles in living yeast. Molecular cell. 1998;2:437–445. doi:S1097-2765(00)80143-4 [pii] (1998) - PubMed
    1. Grunwald D, Singer RH. In vivo imaging of labelled endogenous beta-actin mRNA during nucleocytoplasmic transport. Nature. 2010;467:604–607. - PMC - PubMed
    1. Larson DR, Zenklusen D, Wu B, Chao JA, Singer RH. Real-time observation of transcription initiation and elongation on an endogenous yeast gene. Science (New York, NY) 2011;332:475–478. doi: 10.1126/science.1202142. - DOI - PMC - PubMed

Publication types

MeSH terms