

Native T1 reference values for nonischemic cardiomyopathies and populations with increased cardiovascular risk: A systematic review and meta-analysis
- PMID: 29131444
- PMCID: PMC5873388
- DOI: 10.1002/jmri.25885
Native T1 reference values for nonischemic cardiomyopathies and populations with increased cardiovascular risk: A systematic review and meta-analysis
Abstract
Background: Although cardiac MR and T1 mapping are increasingly used to diagnose diffuse fibrosis based cardiac diseases, studies reporting T1 values in healthy and diseased myocardium, particular in nonischemic cardiomyopathies (NICM) and populations with increased cardiovascular risk, seem contradictory.
Purpose: To determine the range of native myocardial T1 value ranges in patients with NICM and populations with increased cardiovascular risk.
Study type: Systemic review and meta-analysis.
Population: Patients with NICM, including hypertrophic cardiomyopathy (HCM) and dilated cardiomyopathy (DCM), and patients with myocarditis (MC), iron overload, amyloidosis, Fabry disease, and populations with hypertension (HT), diabetes mellitus (DM), and obesity. FIELD STRENGTH/SEQUENCE: (Shortened) modified Look-Locker inversion-recovery MR sequence at 1.5 or 3T.
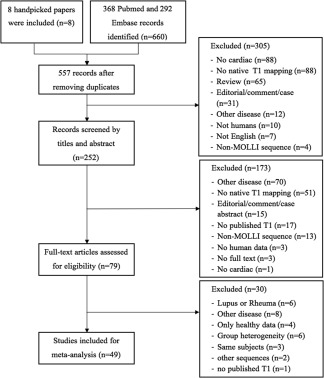
Assessment: PubMed and Embase were searched following the PRISMA guidelines.
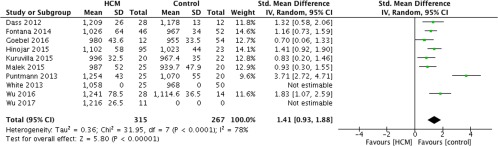
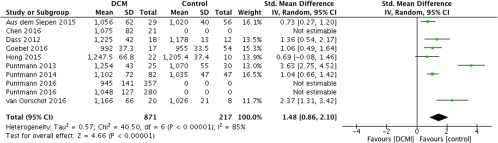
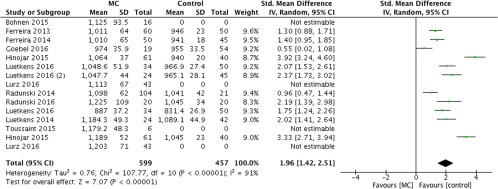
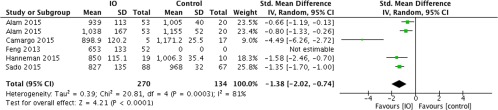
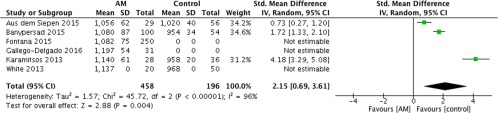
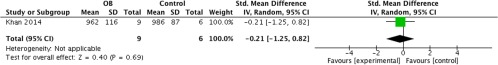
Statistical tests: The summary of standard mean difference (SMD) between the diseased and a healthy control populations was generated using a random-effects model in combination with meta-regression analysis.
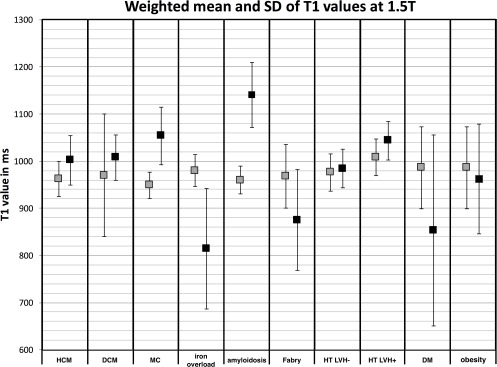
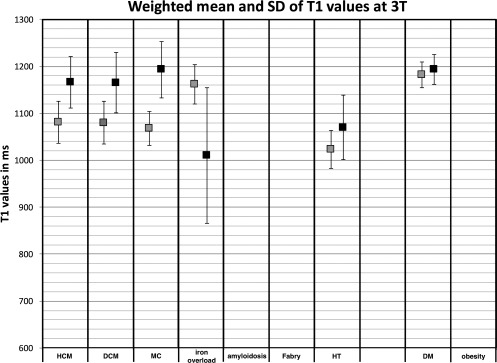
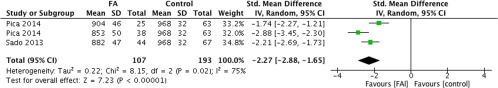
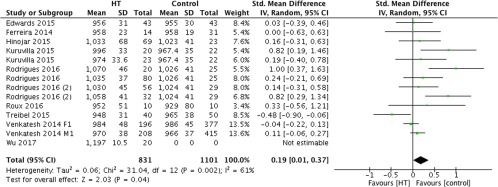
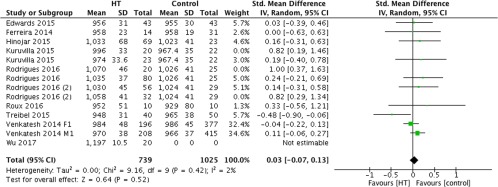
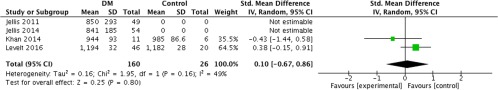
Results: The SMD for HCM, DCM, and MC patients were significantly increased (1.41, 1.48, and 1.96, respectively, P < 0.01) compared with healthy controls. The SMD for HT patients with and without left-ventricle hypertrophy (LVH) together was significantly increased (0.19, P = 0.04), while for HT patients without LVH the SMD was zero (0.03, P = 0.52). The number of studies on amyloidosis, iron overload, Fabry disease, and HT patients with LVH did not meet the requirement to perform a meta-analysis. However, most studies reported a significantly increased T1 for amyloidosis and HT patients with LVH and a significant decreased T1 for iron overload and Fabry disease patients.
Data conclusions: Native T1 mapping by using an (Sh)MOLLI sequence can potentially assess myocardial changes in HCM, DCM, MC, iron overload, amyloidosis, and Fabry disease compared to controls. In addition, it can help to diagnose left-ventricular remodeling in HT patients.
Level of evidence: 2 Technical Efficacy: Stage 3 J. Magn. Reson. Imaging 2018;47:891-912.
Keywords: (Sh)MOLLI; cardiac risk populations; diffuse fibrosis; meta-analysis; native T1 mapping; nonischemic cardiomyopathy.
© 2017 The Authors Journal of Magnetic Resonance Imaging published by Wiley Periodicals, Inc. on behalf of International Society for Magnetic Resonance in Medicine.
Figures
Similar articles
-
Cardiovascular magnetic resonance native T1 mapping in Anderson-Fabry disease: a systematic review and meta-analysis.J Cardiovasc Magn Reson. 2022 May 23;24(1):31. doi: 10.1186/s12968-022-00859-z. J Cardiovasc Magn Reson. 2022. PMID: 35606874 Free PMC article.
-
Left Ventricular Hemodynamic Forces Changes in Fabry Disease: A Cardiac Magnetic Resonance Study.J Magn Reson Imaging. 2025 Jul;62(1):116-127. doi: 10.1002/jmri.29700. Epub 2025 Jan 22. J Magn Reson Imaging. 2025. PMID: 39843855
-
The value of left ventricular T1 mapping and left atrial strain for distinguishing myocardial amyloidosis and hypertrophic cardiomyopathy.Int J Cardiovasc Imaging. 2025 Jul;41(7):1277-1286. doi: 10.1007/s10554-025-03410-0. Epub 2025 Apr 29. Int J Cardiovasc Imaging. 2025. PMID: 40301201
-
Myocardial native T1 and extracellular volume measurements at 5T: Feasibility study and initial experience.J Cardiovasc Magn Reson. 2025 Summer;27(1):101896. doi: 10.1016/j.jocmr.2025.101896. Epub 2025 Apr 21. J Cardiovasc Magn Reson. 2025. PMID: 40268169 Free PMC article.
-
Calcium channel blockers for preventing cardiomyopathy due to iron overload in people with transfusion-dependent beta thalassaemia.Cochrane Database Syst Rev. 2018 Jul 12;7(7):CD011626. doi: 10.1002/14651858.CD011626.pub2. Cochrane Database Syst Rev. 2018. Update in: Cochrane Database Syst Rev. 2023 Nov 17;11:CD011626. doi: 10.1002/14651858.CD011626.pub3. PMID: 29998494 Free PMC article. Updated.
Cited by
-
Personalized biomechanical insights in atrial fibrillation: opportunities & challenges.Expert Rev Cardiovasc Ther. 2023 Jul-Dec;21(11):817-837. doi: 10.1080/14779072.2023.2273896. Epub 2023 Dec 10. Expert Rev Cardiovasc Ther. 2023. PMID: 37878350 Free PMC article. Review.
-
Cardiac Alterations on 3T MRI in Young Adults With Sedentary Lifestyle-Related Risk Factors.Front Cardiovasc Med. 2022 Feb 22;9:840790. doi: 10.3389/fcvm.2022.840790. eCollection 2022. Front Cardiovasc Med. 2022. PMID: 35274012 Free PMC article.
-
Tissue characterisation and myocardial mechanics using cardiac MRI in children with hypertrophic cardiomyopathy.Cardiol Young. 2019 Dec;29(12):1459-1467. doi: 10.1017/S1047951119002397. Epub 2019 Nov 26. Cardiol Young. 2019. PMID: 31769372 Free PMC article.
-
Multi-modality imaging in transthyretin amyloid cardiomyopathy.World J Cardiol. 2019 Nov 26;11(11):266-276. doi: 10.4330/wjc.v11.i11.266. World J Cardiol. 2019. PMID: 31798793 Free PMC article. Review.
-
Evidence-based guideline of the European Association of Nuclear Medicine (EANM) on imaging infection in vascular grafts.Eur J Nucl Med Mol Imaging. 2022 Aug;49(10):3430-3451. doi: 10.1007/s00259-022-05769-x. Epub 2022 Apr 4. Eur J Nucl Med Mol Imaging. 2022. PMID: 35376992 Free PMC article.
References
-
- Ommen SR, Nishimura RA, Tajik A. Hypertrophic cardiomyopathy. Chapter 33 In: Hurst's the Heart. 13th ed. Fuster V, Walsh R, Harrington RA. (eds). New York: McGraw Hill; 2011.
-
- Centers for Disease Control and Prevention . National Diabetes Statistics Report: Estimates of diabetes and its burden in the United States. 2014;2014.
-
- Wang H, Dwyer‐Lindgren L, Lofgren KT, et al. Age‐specific and sex‐specific mortality in 187 countries, 1970‐2010: a systematic analysis for the Global Burden of Disease Study 2010. Lancet 2012;380:2071–2094. - PubMed
Publication types
MeSH terms
LinkOut - more resources
Full Text Sources
Other Literature Sources
Medical
Research Materials
