Randomized Controlled Trial
. 2018 Jan 1;36(1):34-43.
doi: 10.1200/JCO.2017.74.0449. Epub 2017 Nov 13.

Genotype-Specific Minimal Residual Disease Interpretation Improves Stratification in Pediatric Acute Lymphoblastic Leukemia

Affiliations
Randomized Controlled Trial

Genotype-Specific Minimal Residual Disease Interpretation Improves Stratification in Pediatric Acute Lymphoblastic Leukemia

David O'Connor et al. J Clin Oncol. .

Abstract

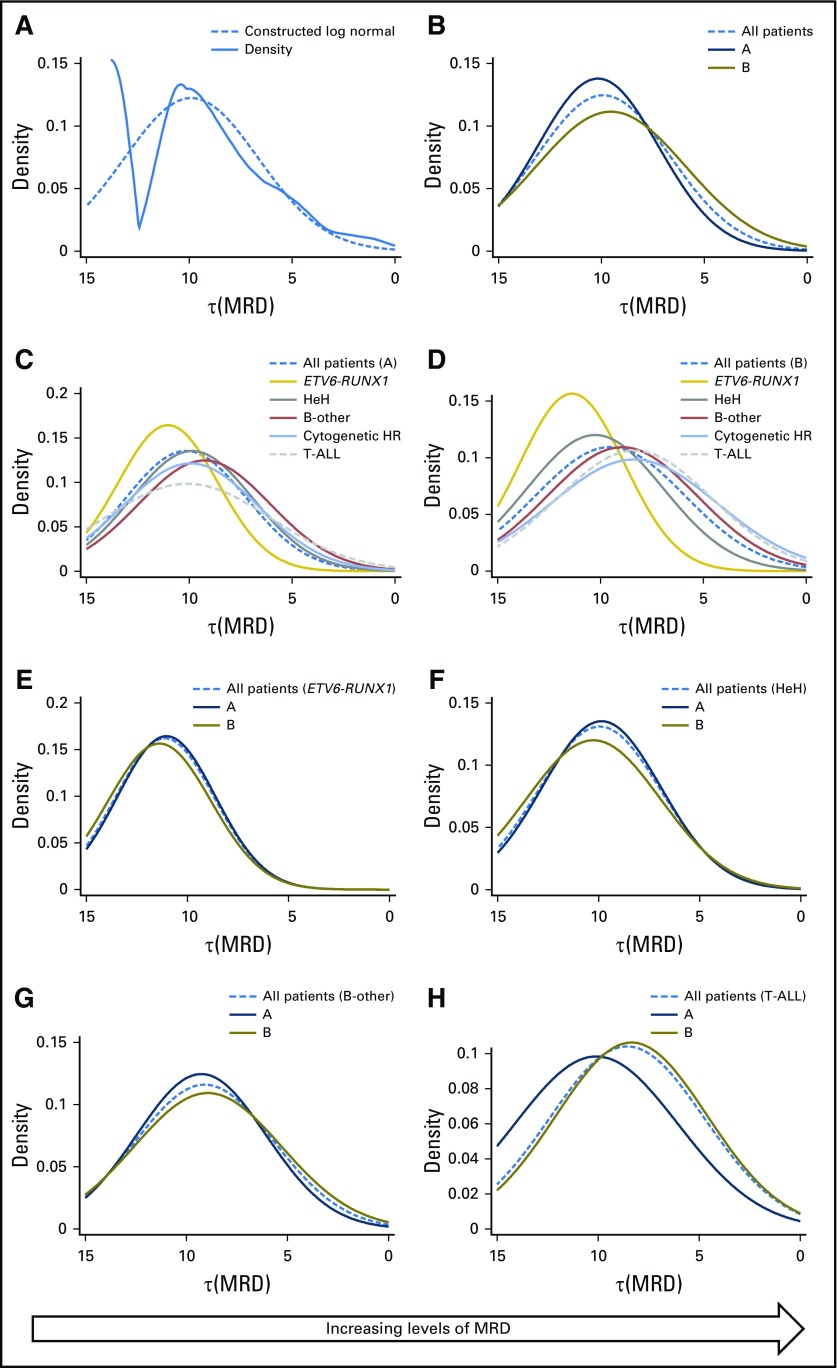
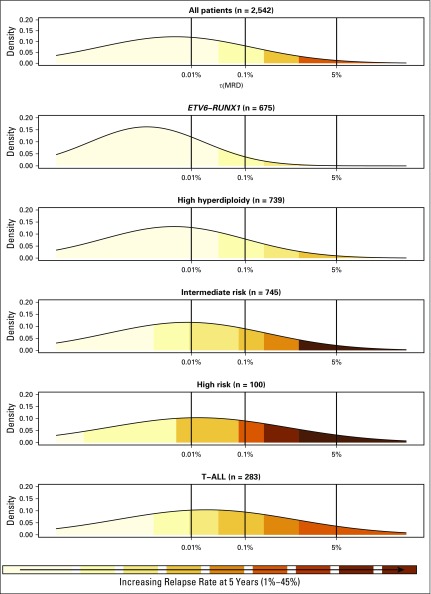
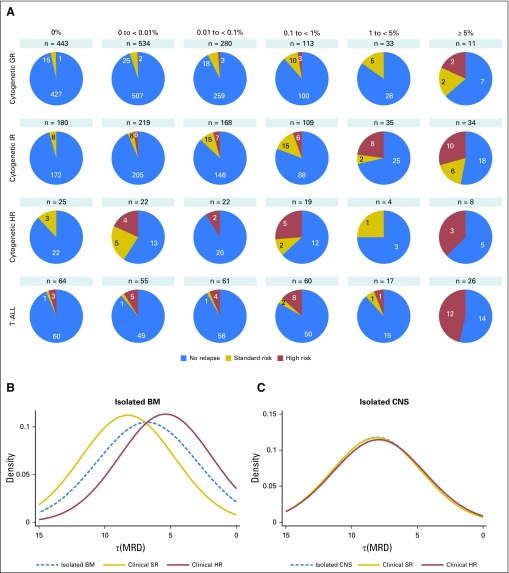
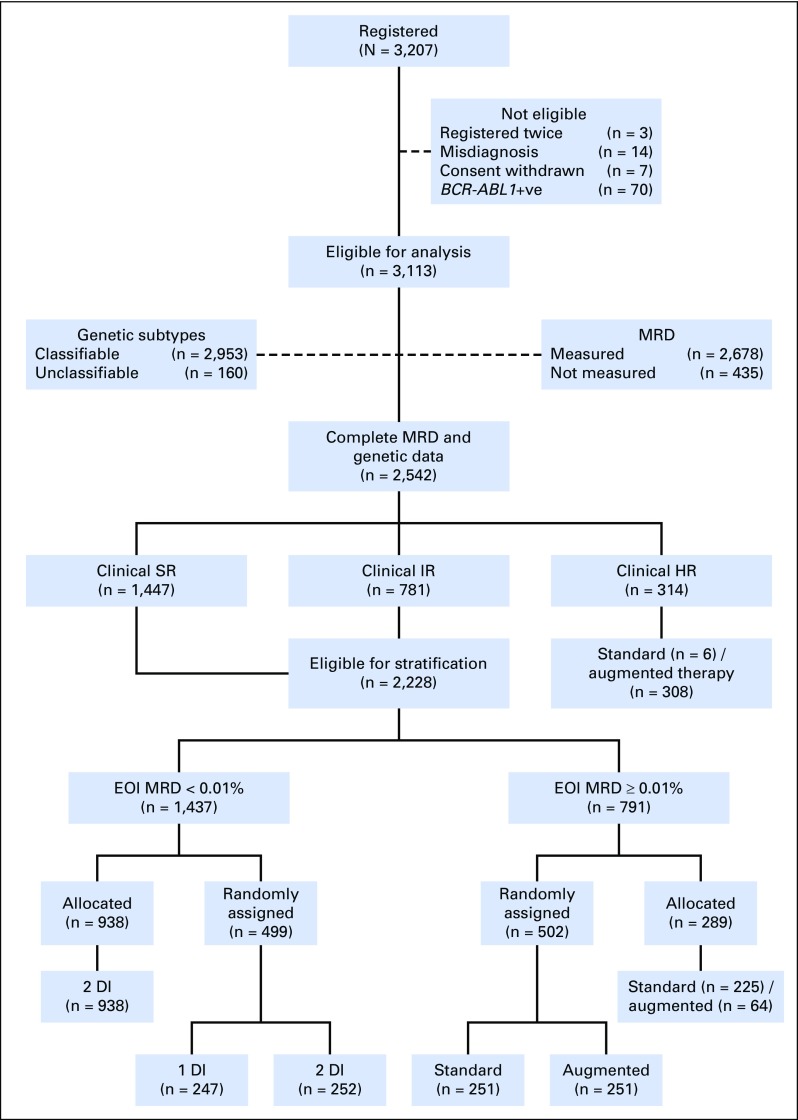
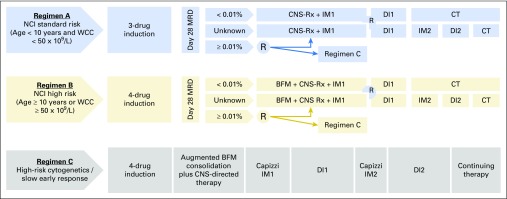
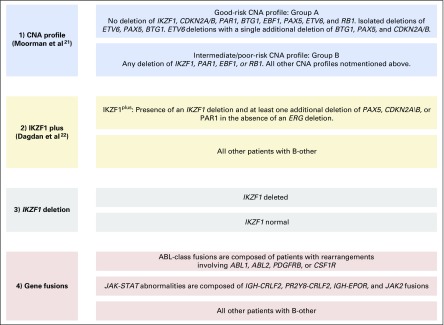
Purpose Minimal residual disease (MRD) and genetic abnormalities are important risk factors for outcome in acute lymphoblastic leukemia. Current risk algorithms dichotomize MRD data and do not assimilate genetics when assigning MRD risk, which reduces predictive accuracy. The aim of our study was to exploit the full power of MRD by examining it as a continuous variable and to integrate it with genetics. Patients and Methods We used a population-based cohort of 3,113 patients who were treated in UKALL2003, with a median follow-up of 7 years. MRD was evaluated by polymerase chain reaction analysis of Ig/TCR gene rearrangements, and patients were assigned to a genetic subtype on the basis of immunophenotype, cytogenetics, and fluorescence in situ hybridization. To examine response kinetics at the end of induction, we log-transformed the absolute MRD value and examined its distribution across subgroups. Results MRD was log normally distributed at the end of induction. MRD distributions of patients with distinct genetic subtypes were different ( P < .001). Patients with good-risk cytogenetics demonstrated the fastest disease clearance, whereas patients with high-risk genetics and T-cell acute lymphoblastic leukemia responded more slowly. The risk of relapse was correlated with MRD kinetics, and each log reduction in disease level reduced the risk by 20% (hazard ratio, 0.80; 95% CI, 0.77 to 0.83; P < .001). Although the risk of relapse was directly proportional to the MRD level within each genetic risk group, absolute relapse rate that was associated with a specific MRD value or category varied significantly by genetic subtype. Integration of genetic subtype-specific MRD values allowed more refined risk group stratification. Conclusion A single threshold for assigning patients to an MRD risk group does not reflect the response kinetics of the different genetic subtypes. Future risk algorithms should integrate genetics with MRD to accurately identify patients with the lowest and highest risk of relapse.


Figures

Fig 1.
Fig 1.
Distribution of the log transformed minimal residual disease (MRD) value, τ(MRD). (A) Raw (solid) and smoothed (dotted) density plots of τ(MRD) for 2,678 patients treated on UKALL2003. (B) Smoothed log normal distributed of τ(MRD) by induction therapy: regimen A (dark blue) and regimen B (brown). (C and D) Smoothed log normal distributions of τ(MRD) stratified by genetics among patients treated on (C) regimen A and (D) regimen B. (E-H) Smoothed log normal distributions of τ(MRD) stratified by induction treatments for patients with (E) ETV6-RUNX1, (F) high hyperdiploidy (HeH), (G) B-other ALL, and (H) T-cell acute lymphoblastic leukemia (T-ALL). HR, high risk.
Fig 2.
Fig 2.
Distribution of selected genetic abnormalities by minimal residual disease category. B-other subcategories are not mutually exclusive and are defined in Appendix Fig A3. CNA, copy number alteration; iAMP21, intrachromosomal amplification of chromosome 21.
Fig 3.
Fig 3.
Relationship between minimal residual disease (MRD) at relapse risk. Each panel shows a smoothed density distribution of MRD for patient-cases in a particular genetic subtype. Shading corresponds to the risk of relapse for patients with that particular MRD level. The dotted line indicates the τ(MRD) value that corresponds to specific MRD values. T-ALL, T-cell acute lymphoblastic leukemia.
Fig 4.
Fig 4.
Diagram that shows the relationship between the end of induction (EOI) minimal residual disease (MRD) and the clinical risk group at relapse. High-risk (HR) relapses are composed of all early relapses (< 18 months from diagnosis), all T-cell acute lymphoblastic leukemia (T-ALL) bone marrow (BM) relapses and, in patients with BCP-ALL, early isolated marrow relapses with all other relapses classified as standard risk. (A) Pie charts illustrating the varying proportion of standard-risk (SR) and HR relapse patients by the level of MRD at EOI and genetic subtype. (B) Smoothed log-normal density plots for patients who experienced an isolated marrow relapse according to clinical risk group at relapse (P < .001). (C) Smoothed log normal density plots for patients who experienced an isolated CNS relapse according to clinical risk group at relapse (P = .95). GR, good risk; IR, intermediate risk.
Fig A1.
Fig A1.
CONSORT diagram for UKALL2003 showing the number of patients who were available for analysis in this study and the random assignment and/or major treatment pathways. Patients who had > 25% of the bone marrow made up of blast cells at day 8 (National Cancer Institute [NCI] high risk) or 15 (NCI standard risk) were reclassified to the clinical high-risk group irrespective of their initial classification and were not eligible for minimal residual disease (MRD) stratification and random assignment. NCI standard-risk (SR) patients had to have an early response of < 25% marrow blasts at the day 15 assessment (reclassified as clinical SR) and NCI high-risk (HR) patients < 25% marrow blasts at day 8 (reclassified as clinical intermediate risk [IR]) to be eligible for random assignment if they were younger than 16 years of age. All patients ≥ 16 years of age were treated as clinical IR irrespective of day 8 or day 15 bone marrow response and were eligible for MRD stratification and random assignment. Morphologic remission status was assessed at day 29 of induction and complete remission was defined as a marrow blast count < 5%. Patients who were not in complete remission at day 29 of induction were not eligible for MRD stratification and random assignment. We stratified clinical SR and IR groups by bone marrow MRD at the end of induction (EOI; day 29 from the start of treatment). augmented therapy, transferred to regimen C; DI, delayed intensification; standard therapy, remaining on regimen A/B.
Fig A2.
Fig A2.
Schematic representation of the ALL2003 treatment protocol. Regimen A was composed of a three-drug induction—vincristine, dexamethasone, and asparaginase—followed by consolidation (daily mercaptopurine and weekly intrathecal methotrexate), CNS-directed therapy, interim maintenance (daily mercaptopurine, weekly methotrexate, monthly vincristine, and corticosteroid pulses), delayed intensification (asparaginase, vincristine, dexamethasone, and doxorubicin), and continuing therapy (oral mercaptopurine and methotrexate, monthly vincristine and corticosteroid pulses, and intrathecal methotrexate every 3 months). Regimen B patients also received daunorubicin during induction and Berlin Frankfurt Munster (BFM) consolidation (4 weeks of cyclophosphamide and cytarabine). Regimen C patients received an additional four doses of vincristine and two doses of pegylated asparaginase during BFM consolidation. Furthermore, regimen C patients received escalating doses of intravenous methotrexate without folinic acid rescue, and vincristine and pegylated asparaginase as interim maintenance (Capizzi maintainance). CT, continuing therapy; DI, delayed intensification; IM, interim maintenance; MRD, minimal residual disease; NCI, National Cancer Institute; WCC, white cell count.
Fig A3.
Fig A3.
Four methods of subclassifying B-other acute lymphoblastic leukemia by genetics. For CDKN2A/B, deletion of either the CDKN2A or CDKN2B probes were sufficient for the locus to be classified as deleted. For PAX5, intragenic amplifications were coded with the deletions, as they are predicted to be functionally equivalent. A deletion in the PAR1 region of chromosome X or Y—del(X)(p22.33p22.33)/del(Y)(p11.32p11.32)—results in the loss of the CSF2RA and IL3RA probes, but the retention of the CRLF2 probe. CNA, copy number alteration.

Comment in

References

    1. Borowitz MJ, Devidas M, Hunger SP, et al. : Clinical significance of minimal residual disease in childhood acute lymphoblastic leukemia and its relationship to other prognostic factors: A Children’s Oncology Group study. Blood 111:5477-5485, 2008 - PMC - PubMed
    1. Vora A, Goulden N, Wade R, et al. : Treatment reduction for children and young adults with low-risk acute lymphoblastic leukaemia defined by minimal residual disease (UKALL 2003): A randomised controlled trial. Lancet Oncol 14:199-209, 2013 - PubMed
    1. Coustan-Smith E, Sancho J, Hancock ML, et al. : Clinical importance of minimal residual disease in childhood acute lymphoblastic leukemia. Blood 96:2691-2696, 2000 - PubMed
    1. Bartram J, Wade R, Vora A, et al. : Excellent outcome of minimal residual disease-defined low-risk patients is sustained with more than 10 years follow-up: Results of UK paediatric acute lymphoblastic leukaemia trials 1997-2003. Arch Dis Child 101:449-454, 2016 - PubMed
    1. Vora A, Goulden N, Mitchell C, et al. : Augmented post-remission therapy for a minimal residual disease-defined high-risk subgroup of children and young people with clinical standard-risk and intermediate-risk acute lymphoblastic leukaemia (UKALL 2003): A randomised controlled trial. Lancet Oncol 15:809-818, 2014 - PubMed

Publication types

MeSH terms