. 2018 Jun;74(2):595-605.
doi: 10.1111/biom.12812. Epub 2017 Nov 13.

Covariate-adjusted Spearman's rank correlation with probability-scale residuals

Affiliations

Covariate-adjusted Spearman's rank correlation with probability-scale residuals

Qi Liu et al. Biometrics. 2018 Jun.

Abstract

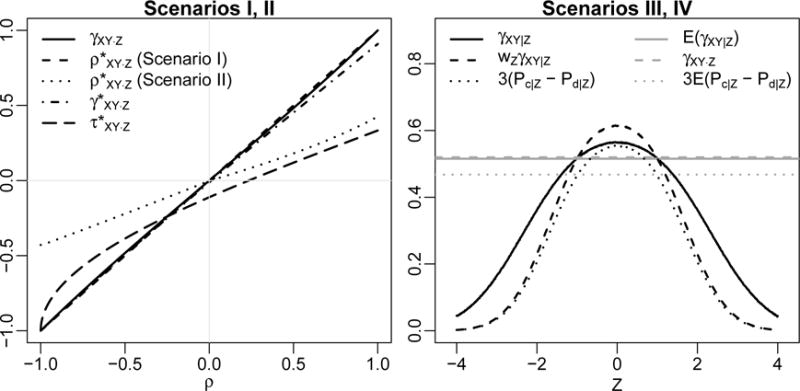
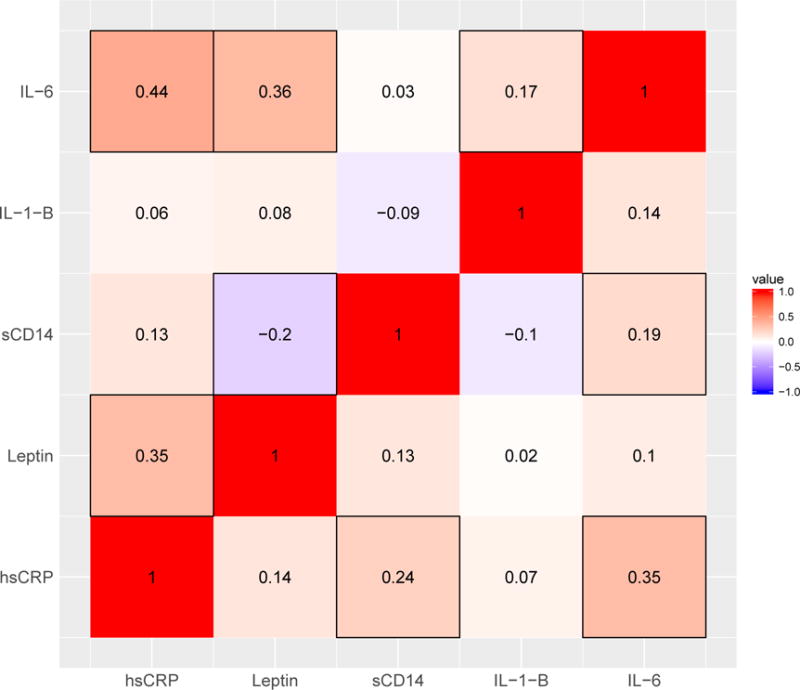
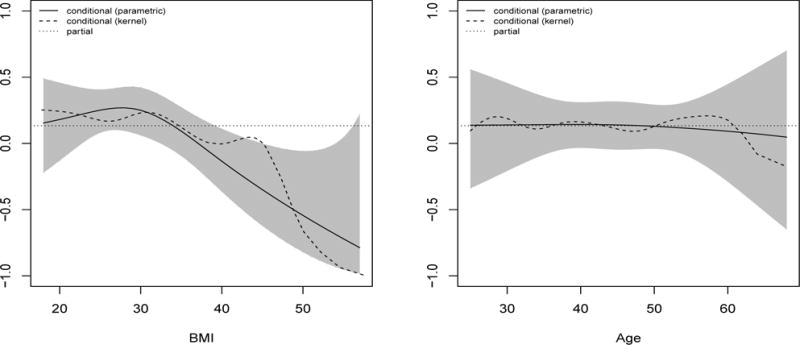
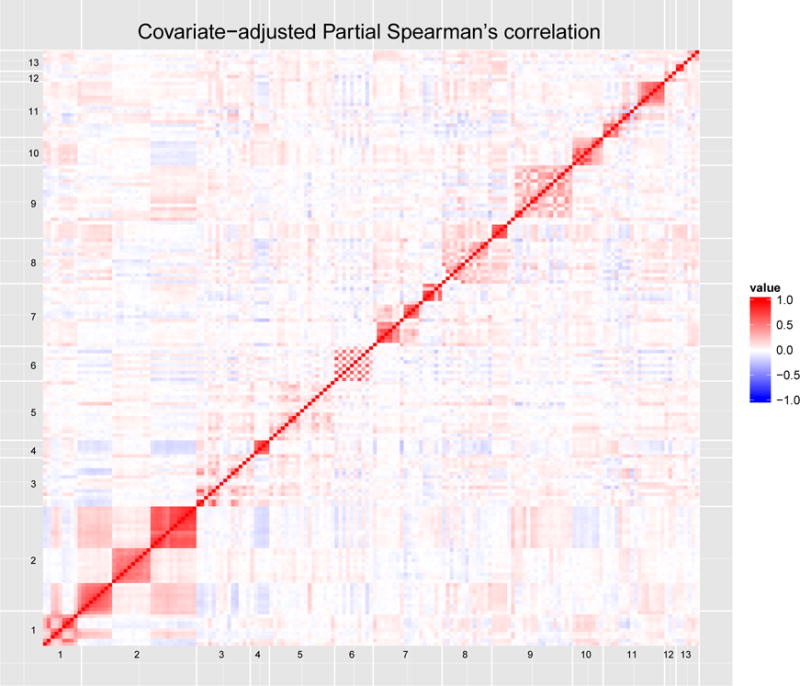
It is desirable to adjust Spearman's rank correlation for covariates, yet existing approaches have limitations. For example, the traditionally defined partial Spearman's correlation does not have a sensible population parameter, and the conditional Spearman's correlation defined with copulas cannot be easily generalized to discrete variables. We define population parameters for both partial and conditional Spearman's correlation through concordance-discordance probabilities. The definitions are natural extensions of Spearman's rank correlation in the presence of covariates and are general for any orderable random variables. We show that they can be neatly expressed using probability-scale residuals (PSRs). This connection allows us to derive simple estimators. Our partial estimator for Spearman's correlation between X and Y adjusted for Z is the correlation of PSRs from models of X on Z and of Y on Z, which is analogous to the partial Pearson's correlation derived as the correlation of observed-minus-expected residuals. Our conditional estimator is the conditional correlation of PSRs. We describe estimation and inference, and highlight the use of semiparametric cumulative probability models, which allow preservation of the rank-based nature of Spearman's correlation. We conduct simulations to evaluate the performance of our estimators and compare them with other popular measures of association, demonstrating their robustness and efficiency. We illustrate our method in two applications, a biomarker study and a large survey.

Keywords: Conditional correlation; Cumulative probability model; Partial correlation; Rank-based statistic; Semiparametric transformation model.


Figures

Figure 1
Figure 1
Correlation parameters in Scenarios I, II (left panel) and III, IV (right panel). In the left panel, γXY·Z is the population parameter of our partial Spearman’s rank correlation; ρXYZ, γXYZ, and τXYZ are traditional partial Pearson’s, Spearman’s, and Kendall’s correlations based on (1), respectively. In the right panel, γXY|Z is the population parameter of our conditional Spearman’s rank correlation as a function of Z, and γXY·Z = E(wZγXY|Z) is the population parameter of our partial Spearman’s rank correlation, which is constant over Z. For comparison with γXY|Z, we also show wZγXY|Z and 3(Pc|ZPd|Z), i.e., 3 times the difference between the probability of concordance and the probability of discordance conditional on Z, which is what γXY|Z would be if X and Y were both continuous. For comparison with γXY·Z, we also show E(γXY|Z) and 3E(Pc|ZPd|Z).
Figure 2
Figure 2
Heat map showing the pairwise Spearman’s rank correlations between 5 biomarkers. The upper-left correlations are unadjusted, the lower-right correlations are partial correlations adjusted for age, sex, race, BMI, CD4 cell count, smoking status, and study cohort. Shading denotes the strength of the correlation with those closer to −1 and 1 being darker. Boxes are placed around correlations whose 95% confidence intervals do not contain zero. This figure appears in color in the electronic version of this article.
Figure 3
Figure 3
Partial Spearman’s rank correlations between leptin and sCD14 conditional on BMI (left panel) and age (right panel). The solid curve (and shaded region) represent estimates (and pointwise 95% confidence intervals) using a parametric estimation procedure. Specifically, the parametric estimate fit separate ordinary least squares models to the product of the residuals and the square of each set of residuals, including BMI in the models using natural splines with 2 degrees of freedom. The dashed curve represents estimates using a Gaussian kernel smoother, using Silverman’s rule of thumb to select the bandwidth (h = 2.7).
Figure 4
Figure 4
The heatmap of our partial estimators for pairwise Spearman’s rank correlation adjusting for demographic factors for responses to 171 questions from 13 modules of the SCIP survey labeled as 1: overall quality of life, 2: mental health, 3: income, 4: food and nutrition, 5: material goods, 6: transportation, 7: health care, 8: voluntary counseling and testing (VCT) services, 9: HIV prevention, 10: social support, 11: community service, 12: education test result, and 13: perception of education. This figure appears in color in the electronic version of this article. An interactive figure of results is at https://scip.shinyapps.io/scip_app.

References

    1. Andrade BB, Singh A, Narendran G, Schechter ME, Nayak K, Subramanian S, et al. Mycobacterial antigen driven activation of cd14++cd16− monocytes is a predictor of tuberculosis-associated immune reconstitution inflammatory syndrome. PLOS Pathogens. 2014;10:e1004433. - PMC - PubMed
    1. Bross IDJ. How to use ridit analysis. Biometrics. 1958;14:18–38.
    1. Genest C, Nešlehová J. A primer on copulas for count data. Astin Bulletin. 2007;37:475–515.
    1. Gijbels I, Veraverbeke N, Omelka M. Conditional copulas, association measures and their applications. Computational Statistics and Data Analysis. 2011;55:1919–1932.
    1. Gripenberg G. Confidence intervals for partial rank correlations. Journal of the American Statistical Association. 1992;87:546–551.

Publication types