. 2017 Nov 23;551(7681):517-520.
doi: 10.1038/nature24473. Epub 2017 Nov 8.

A neoantigen fitness model predicts tumour response to checkpoint blockade immunotherapy

Affiliations

A neoantigen fitness model predicts tumour response to checkpoint blockade immunotherapy

Marta Łuksza et al. Nature. .

Abstract

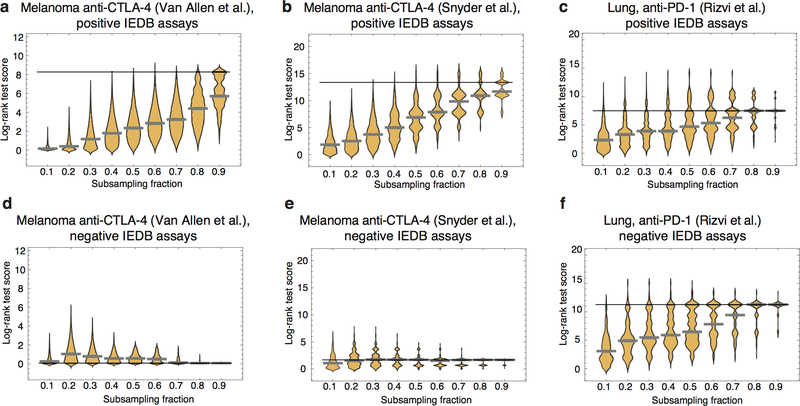
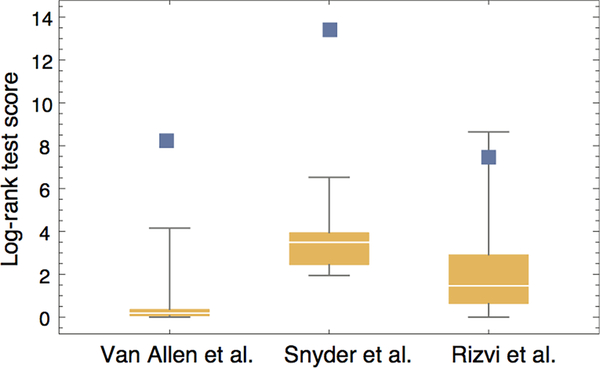
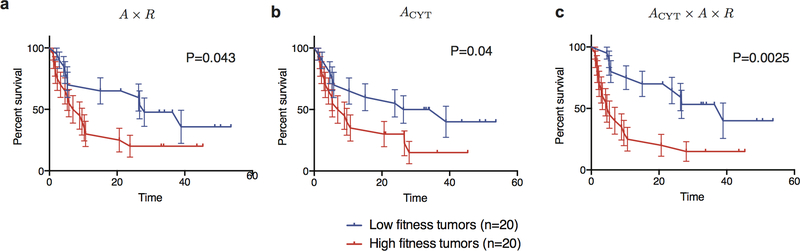
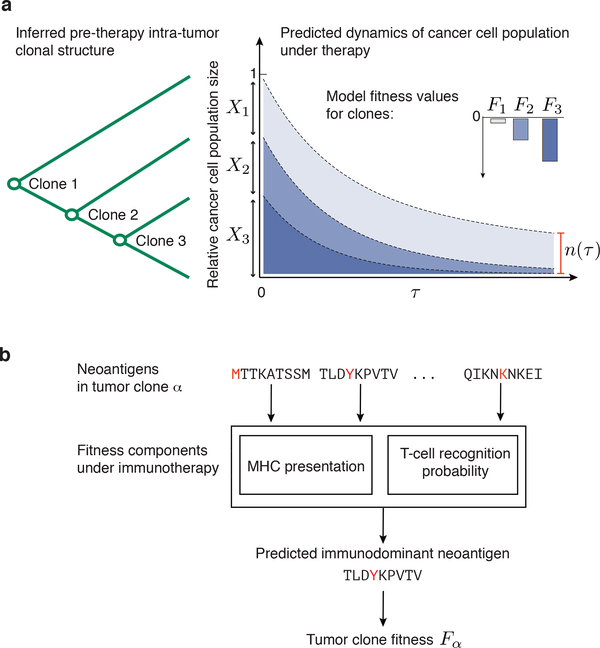
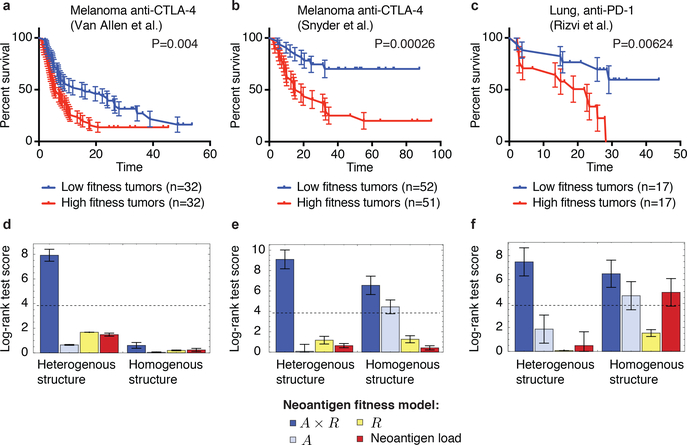
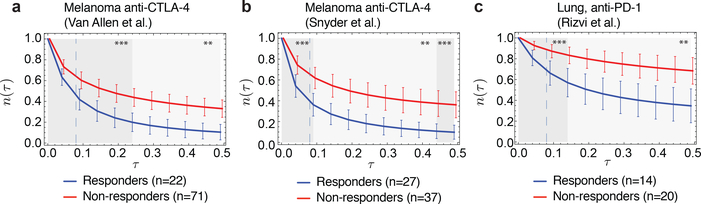
Checkpoint blockade immunotherapies enable the host immune system to recognize and destroy tumour cells. Their clinical activity has been correlated with activated T-cell recognition of neoantigens, which are tumour-specific, mutated peptides presented on the surface of cancer cells. Here we present a fitness model for tumours based on immune interactions of neoantigens that predicts response to immunotherapy. Two main factors determine neoantigen fitness: the likelihood of neoantigen presentation by the major histocompatibility complex (MHC) and subsequent recognition by T cells. We estimate these components using the relative MHC binding affinity of each neoantigen to its wild type and a nonlinear dependence on sequence similarity of neoantigens to known antigens. To describe the evolution of a heterogeneous tumour, we evaluate its fitness as a weighted effect of dominant neoantigens in the subclones of the tumour. Our model predicts survival in anti-CTLA-4-treated patients with melanoma and anti-PD-1-treated patients with lung cancer. Importantly, low-fitness neoantigens identified by our method may be leveraged for developing novel immunotherapies. By using an immune fitness model to study immunotherapy, we reveal broad similarities between the evolution of tumours and rapidly evolving pathogens.


Conflict of interest statement

Conflicts of interest

M.Ł. has consulted for Merck. V.P.B. has received research funding from Bristol- Myers Squibb. A.J.L. is on the board of directors for Adaptive Biotechnologies and has consulted for Jansen pharmaceuticals and Merck. T.A.C. is a co-founder of Gritstone Oncology and holds equity. T.A.C. receives grant funding from Bristol Myers Squibb. N.A.R is co-founder and shareholder of Gritstone Oncology. M.D.H has consulted for Genentech, BMS, Merck, AstraZeneca, Janssen, Novartis. B.D.G. has consulted for Merck.

Figures

Extended Data Figure 1 |
Extended Data Figure 1 |. Inferred MHC binding affinities of mutant versus wildtype peptides.
Neoantigens used in this study are 9-residue long peptides affinities predicted to be less than 500nM by NetMHC3.419 (SI). We plot predicted affinities of mutant peptides, designatedKdMT, versus the predicted dissociation affinities of the wildtype peptides, which generated them, designatedKdWT. A single point mutation can lead to predicted dissociation constant difference of up to 4 orders of magnitude.
Extended Data Figure 2 |
Extended Data Figure 2 |. Positions 2 and 9 have a subset of neoantigens with less predictive value.
The violin plots represent data density at a given value on a vertical axis. a, Neoantigens coming from mutations at position 2 or 9 tend to have wildtype peptides with larger predicted affinities. In particular, this is magnified if the corresponding wildtype residue is non-hydrophobic. b, Those biases are reflected in a wider distribution of amplitudes (Methods, equation (6)) for wildtype peptides with non-hydrophobic residues at positions 2 and 9. c, Shannon entropy of amino acid diversity by position in neoantigens, shown for all distinct HLA-types and computed based on neoantigens across all datasets. Positions 2 and 9 have lower entropy than other residues. Other sites have the same entropy as the overall proteome and are therefore unconstrained. Five HLA with non-canonical entropy profiles are singled out in the plot. These HLA- types contributed only 5 informative neoantigens across all datasets and therefore are not treated differentially in our model.
Extended Data Figure 3 |
Extended Data Figure 3 |. Survival analysis score landscape as a function of model parameters
a-c, The landscape of log-rank test scores as the function of the parameters of the TCR binding model (a and 1/k), shown for the consistent choice of 𝜏 = 0.09, colors represent the significance level of the long-rank test. The regions of high scores are similar across all three datasets. The point corresponding to consistent parameters (a = 26 and k = 4.87) is marked by a black dot in each plot. d-f, Log-rank score for fitness model at consistent binding function parameters, plotted as a function of 𝜏. Dashed vertical lines are at 𝜏 = 0.09, thin solid lines mark the score values corresponding to significance of 0.05, 0.01 and 0.005. (n=103 (a, d), n=64 (b, e), n=34 (c, f)).
Extended Data Figure 4 |
Extended Data Figure 4 |. Alignments to IEDB epitopes.
The TCR recognition probability for a neoantigen is a sigmoidal function of the neoantigen’s alignment scores with IEDB epitopes, here shown as evaluated for the set of neoantigens from Van Allen et al. cohort patients, using the consistent set of parameters.
Extended Data Figure 5 |
Extended Data Figure 5 |. Effect of IEDB sequence content on predictive power of neoantigen fitness model.
Predictions were performed using subsampled IEDB epitope sequences, with subsampling rate varying between 0.1 and 0.9. For each rate, 10,000 iterations were performed to obtain a distribution of log-rank test scores. The violin plots represent data density at a given value on a vertical axis (n=10,000). Solid black lines mark the log-rank test score of the prediction on the full set of epitope sequences and gray thick lines mark the median scores on subsampled data. a-c, Subsampling of the original set of IEDB sequences, supported by positive T-cell assays, shows that quality of predictions decreases with subsampling rate. Prediction quality is more robust in the Snyder et al. and Rizvi et al. datasets. d-f, Analogous subsampling procedure was repeated on IEDB sequences not supported by positive T-cell assays. For Van Allen et al. and Snyder et al. model performance is substantially lowered.
Extended Data Figure 6 |
Extended Data Figure 6 |. Reshuffling patient HLA-types reduces predictive power of neoantigen fitness model.
In each cohort, we performed 10 iterations of reshuffling patient HLA-types, followed by computational neoantigen prediction, fitness model calculation and survival analysis. We report the distribution of log-rank test scores over these iterations: boxes mark 75% confidence intervals and whiskers mark the range of scores (n=10). The score values for the model on original data are marked with blue squares.
Extended Data Figure 7 |
Extended Data Figure 7 |. Cytolytic score improves prediction quality.
a, Kaplan-Meier curves of overall survival shown for our model applied to Van Allen et al. for n=40 patient subset with transcriptional data. Samples are split by the median value of their tumor’s relative population size (𝜏) (equation (1)). Error bars represent standard error due to sample size. b, Model optimized for cytolytic score significantly separates patients (Methods). c, Inclusion of cytolytic score in our model improves prediction on 40 patient subset. The p-values from log-rank tests comparing the two KM curves re shown above each plot. In a and c, we use consistent parameters trained on the three cohorts (Extended Data Fig. 2); in b parameter 𝜏 is optimized.
Figure 1 |
Figure 1 |. Evolutionary tumor dynamics under strong immune selection and a neoantigen fitness model based on immune interactions.
a, Clones are inferred from a tumor’s genealogical tree. We predict (𝜏), the future effective size of the cancer cell population, relative to its size at the start of therapy (equation (1)) by evolving clones under the model over a fixed time-scale, 𝜏. Application of therapy can decrease fitness of clones depending on their neoantigens. Clones with strongly negative fitness have greater loss of population size than more fit ones. b, Our model accounts for the presence of dominant neoantigens within a clone, α, by modeling presentation and recognition of inferred neoantigens, assigning fitness to a clone, Fα.
Figure 2 |
Figure 2 |. Neoantigen fitness model is predictive of survival after checkpoint blockade immunotherapy.
a-c, Tumor fitness is calculated across two melanoma cohorts treated with anti-CTLA-4, and one lung cancer cohort treated with anti-PD-1. Kaplan-Meier curves of overall survival are displayed for each, with samples split by the median value of their tumor’s relative population size (𝜏) (equation (1)). Error bars represent standard error due to sample size (SI). The p-values from log-rank tests comparing the two KM curves are shown above each plot. d-f, Log-rank test score for the full neoantigen fitness model (navy blue), for partial models accounting for a single feature of the full model (light blue and yellow) and for the neoantigen load model (red). All models are evaluated both over a tumor’s clonal structure (heterogenous, left) and without clonality (homogenous, right). All model scores are presented for parameters obtained on independent training data (Methods). Error bars are the standard deviation of the log-rank test score acquired from survival analysis with one sample removed at a time (d, n=64, e, n=103, f, n=34). Dashed lines correspond to 5% significance.
Figure 3 |
Figure 3 |. Predicted evolutionary dynamics in cohorts.
a, Distribution of predicted relative population size 𝑛(𝜏) for responders and non-responders at consistent parameters across a, Van Allen et al. b, Snyder et al.; and c, Rizvi et al. cohorts. Responders and non-responders were defined within those studies; samples not classified as either are excluded. Error bars are 95% confidence intervals around the population average. The dashed line indicates the consistent time-scale, 𝜏 = 0.09, used across all three datasets for survival predictions (Methods and Extended Data Fig. 3). The significance of separation of the two groups was computed with Kolmogorov-Smirnov test, p-values at 𝜏 = 0.09 are 0.0016 (Van Allen et al.), 0.00084 (Snyder et al.) and 0.00071 (Rizvi et al.). Background shading represents significance of separation of the two groups as a continuous function of 𝜏 (**p<0.01, ***p<0.001).

Comment in

  • How T cells spot tumour cells.
    Sarkizova S, Hacohen N. Sarkizova S, et al. Nature. 2017 Nov 23;551(7681):444-446. doi: 10.1038/d41586-017-07267-9. Nature. 2017. PMID: 29168843 No abstract available.
  • Immunotherapy: Relying on quality over quantity.
    Romero D. Romero D. Nat Rev Clin Oncol. 2018 Jan;15(1):6-7. doi: 10.1038/nrclinonc.2017.189. Epub 2017 Nov 28. Nat Rev Clin Oncol. 2018. PMID: 29182163 No abstract available.

References

    1. Topalian SL, Drake CG & Pardoll DM Immune checkpoint blockade: a common denominator approach to cancer therapy. Cancer Cell 27, 450–61 (2015). - PMC - PubMed
    1. Schumacher TN & Schreiber RD Neoantigens in cancer immunotherapy. Science 348, 69–74 (2015). - PubMed
    1. Gubin MM, Artyomov MN, Mardis ER & Schreiber RD Tumor neoantigens: building a framework for personalized cancer immunotherapy. J. Clin. Invest 125, 3413–3421 (2015). - PMC - PubMed
    1. Snyder A et al. Genetic Basis for Clinical Response to CTLA-4 Blockade in Melanoma. N. Engl. J. Med 371, 2189–2199 (2014). - PMC - PubMed
    1. Van Allen EM et al. Genomic correlates of response to CTLA-4 blockade in metastatic melanoma. Science 350, 207–211 (2015) - PMC - PubMed

Publication types

MeSH terms