

Rapid evolutionary divergence of diploid and allotetraploid Gossypium mitochondrial genomes
- PMID: 29132310
- PMCID: PMC5683544
- DOI: 10.1186/s12864-017-4282-5
Rapid evolutionary divergence of diploid and allotetraploid Gossypium mitochondrial genomes
Abstract
Background: Cotton (Gossypium spp.) is commonly grouped into eight diploid genomic groups and an allotetraploid genomic group, AD. The mitochondrial genomes supply new information to understand both the evolution process and the mechanism of cytoplasmic male sterility. Based on previously released mitochondrial genomes of G. hirsutum (AD1), G. barbadense (AD2), G. raimondii (D5) and G. arboreum (A2), together with data of six other mitochondrial genomes, to elucidate the evolution and diversity of mitochondrial genomes within Gossypium.
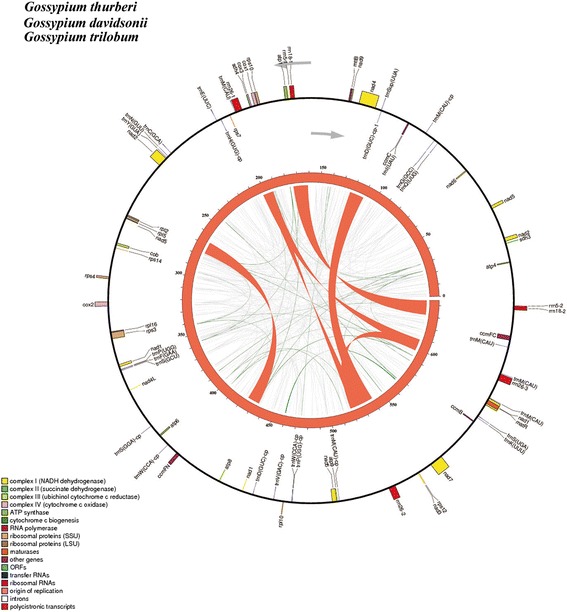
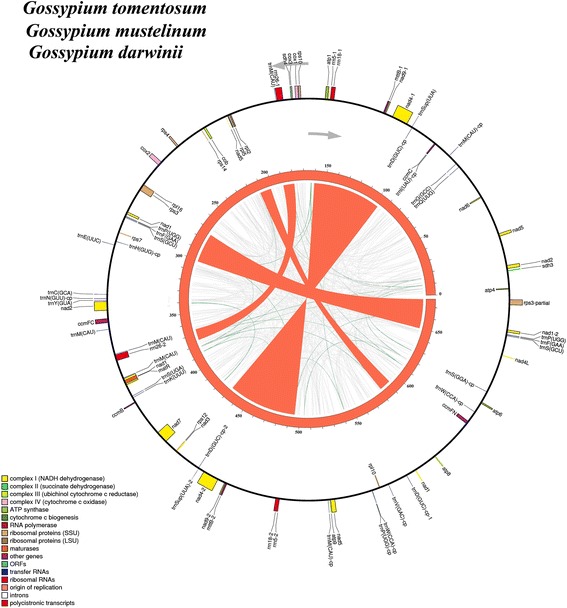
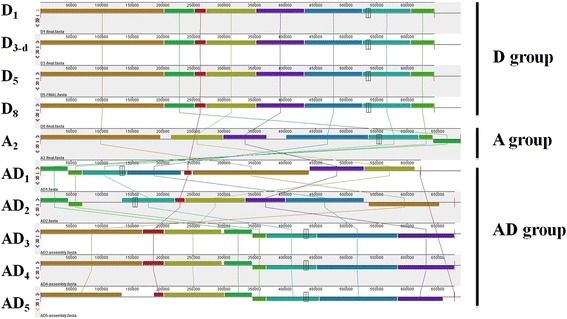
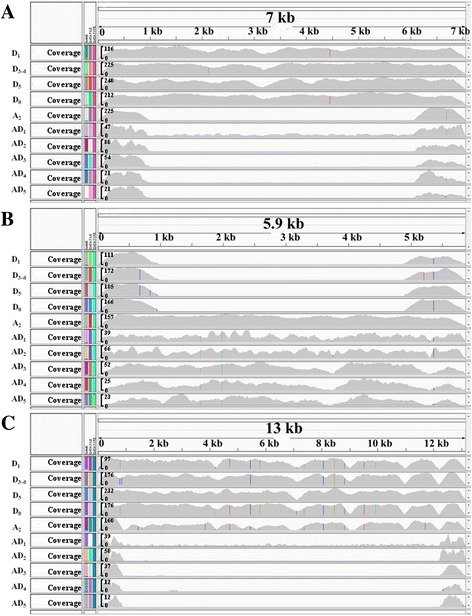
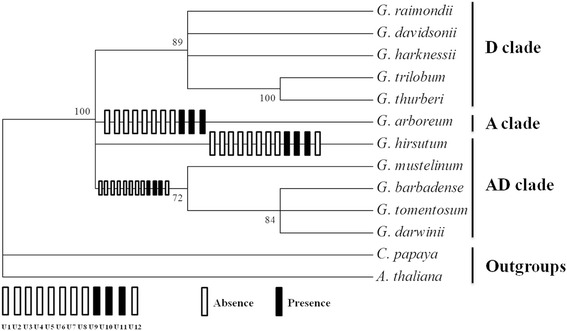
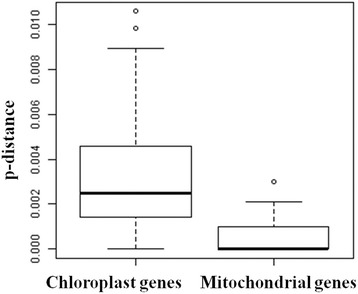
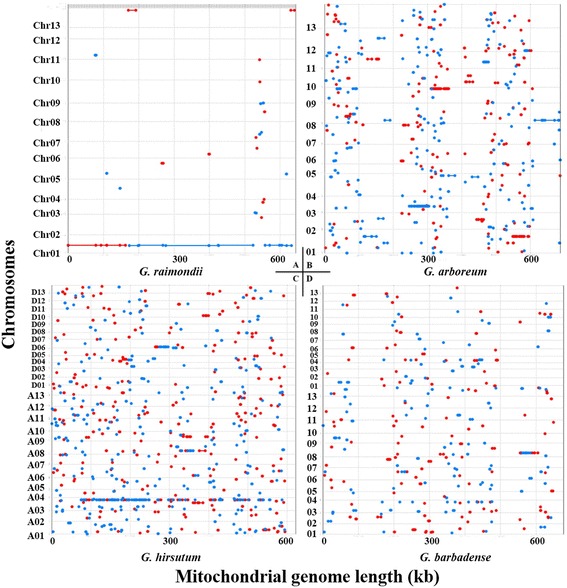
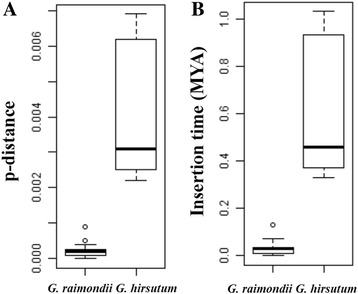
Results: Six Gossypium mitochondrial genomes, including three diploid species from D and three allotetraploid species from AD genome groups (G. thurberi D1, G. davidsonii D3-d and G. trilobum D8; G. tomentosum AD3, G. mustelinum AD4 and G. darwinii AD5), were assembled as the single circular molecules of lengths about 644 kb in diploid species and 677 kb in allotetraploid species, respectively. The genomic structures of mitochondrial in D group species were identical but differed from the mitogenome of G. arboreum (A2), as well as from the mitogenomes of five species of the AD group. There mainly existed four or six large repeats in the mitogenomes of the A + AD or D group species, respectively. These variations in repeat sequences caused the major inversions and translocations within the mitochondrial genome. The mitochondrial genome complexity in Gossypium presented eight unique segments in D group species, three specific fragments in A + AD group species and a large segment (more than 11 kb) in diploid species. These insertions or deletions were most probably generated from crossovers between repetitive or homologous regions. Unlike the highly variable genome structure, evolutionary distance of mitochondrial genes was 1/6th the frequency of that in chloroplast genes of Gossypium. RNA editing events were conserved in cotton mitochondrial genes. We confirmed two near full length of the integration of the mitochondrial genome into chromosome 1 of G. raimondii and chromosome A03 of G. hirsutum, respectively, with insertion time less than 1.03 MYA.
Conclusion: Ten Gossypium mitochondrial sequences highlight the insights to the evolution of cotton mitogenomes.
Keywords: Comparative genomics; Gossypium; Mitochondrial genomes; Multiple DNA rearrangement; Repeat sequences; Unique segments.
Conflict of interest statement
Ethics approval and consent to participate
Not applicable.
Consent for publication
Not applicable.
Competing interests
The authors declare that they have no competing interests.
Publisher’s Note
Springer Nature remains neutral with regard to jurisdictional claims in published maps and institutional affiliations.
Figures
Similar articles
-
Intergenomic gene transfer in diploid and allopolyploid Gossypium.BMC Plant Biol. 2019 Nov 12;19(1):492. doi: 10.1186/s12870-019-2041-2. BMC Plant Biol. 2019. PMID: 31718541 Free PMC article.
-
Entire nucleotide sequences of Gossypium raimondii and G. arboreum mitochondrial genomes revealed A-genome species as cytoplasmic donor of the allotetraploid species.Plant Biol (Stuttg). 2017 May;19(3):484-493. doi: 10.1111/plb.12536. Epub 2017 Feb 2. Plant Biol (Stuttg). 2017. PMID: 28008701
-
Genome-wide comparative analysis of NBS-encoding genes in four Gossypium species.BMC Genomics. 2017 Apr 12;18(1):292. doi: 10.1186/s12864-017-3682-x. BMC Genomics. 2017. PMID: 28403834 Free PMC article.
-
Transposable elements play an important role during cotton genome evolution and fiber cell development.Sci China Life Sci. 2016 Feb;59(2):112-21. doi: 10.1007/s11427-015-4928-y. Epub 2015 Dec 19. Sci China Life Sci. 2016. PMID: 26687725 Review.
-
Recent advances in understanding mitochondrial genome diversity.F1000Res. 2020 Apr 17;9:F1000 Faculty Rev-270. doi: 10.12688/f1000research.21490.1. eCollection 2020. F1000Res. 2020. PMID: 32399193 Free PMC article. Review.
Cited by
-
Comparative analysis of codon usage between Gossypium hirsutum and G. barbadense mitochondrial genomes.Mitochondrial DNA B Resour. 2020 Jun 17;5(3):2500-2506. doi: 10.1080/23802359.2020.1780969. Mitochondrial DNA B Resour. 2020. PMID: 33457843 Free PMC article.
-
Intergenomic gene transfer in diploid and allopolyploid Gossypium.BMC Plant Biol. 2019 Nov 12;19(1):492. doi: 10.1186/s12870-019-2041-2. BMC Plant Biol. 2019. PMID: 31718541 Free PMC article.
-
Mitogenomic and Phylogenetic Analysis of the Entomopathogenic Fungus Ophiocordyceps lanpingensis and Comparative Analysis with Other Ophiocordyceps Species.Genes (Basel). 2023 Mar 14;14(3):710. doi: 10.3390/genes14030710. Genes (Basel). 2023. PMID: 36980982 Free PMC article.
-
The comparison of four mitochondrial genomes reveals cytoplasmic male sterility candidate genes in cotton.BMC Genomics. 2018 Oct 26;19(1):775. doi: 10.1186/s12864-018-5122-y. BMC Genomics. 2018. PMID: 30367630 Free PMC article.
-
Widespread incomplete lineage sorting and introgression shaped adaptive radiation in the Gossypium genus.Plant Commun. 2024 Feb 12;5(2):100728. doi: 10.1016/j.xplc.2023.100728. Epub 2023 Oct 5. Plant Commun. 2024. PMID: 37803827 Free PMC article.
References
-
- Backert S, Nielsen BL, Borner T. The mystery of the rings: structure and replication of mitochondrial genomes from higher plants. Trends Plant Sci. 1997;2(12):477–483. doi: 10.1016/S1360-1385(97)01148-5. - DOI
-
- Chen Z, Zhao N, Li S, Grover CE, Nie H, Wendel JF, et al. Plant mitochondrial genome evolution and cytoplasmic male sterility. Crit Rev Plant Sci. 2017;36(1):55–69. doi: 10.1080/07352689.2017.1327762. - DOI
MeSH terms
Grants and funding
LinkOut - more resources
Full Text Sources
Other Literature Sources
Miscellaneous
