

Integrative microRNA and mRNA deep-sequencing expression profiling in endemic Burkitt lymphoma
- PMID: 29132323
- PMCID: PMC5683570
- DOI: 10.1186/s12885-017-3711-9
Integrative microRNA and mRNA deep-sequencing expression profiling in endemic Burkitt lymphoma
Abstract
Background: Burkitt lymphoma (BL) is characterized by overexpression of the c-myc oncogene, which in the vast majority of cases is a consequence of an IGH/MYC translocation. While myc is the seminal event, BL is a complex amalgam of genetic and epigenetic changes causing dysregulation of both coding and non-coding transcripts. Emerging evidence suggest that abnormal modulation of mRNA transcription via miRNAs might be a significant factor in lymphomagenesis. However, the alterations in these miRNAs and their correlations to their putative mRNA targets have not been extensively studied relative to normal germinal center (GC) B cells.
Methods: Using more sensitive and specific transcriptome deep sequencing, we compared previously published small miRNA and long mRNA of a set of GC B cells and eBL tumors. MiRWalk2.0 was used to identify the validated target genes for the deregulated miRNAs, which would be important for understanding the regulatory networks associated with eBL development.
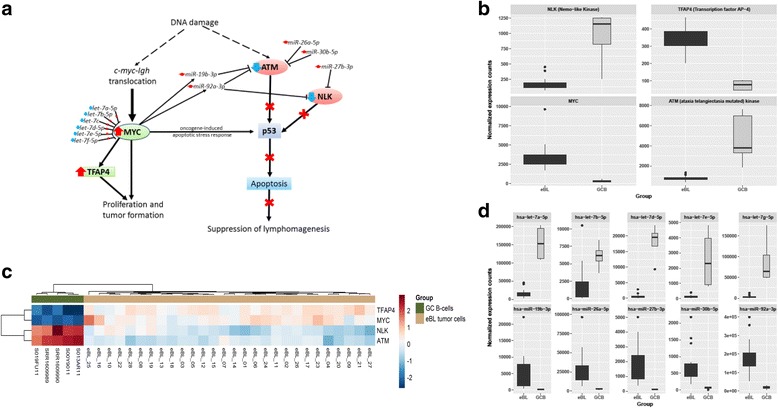
Results: We found 211 differentially expressed (DE) genes (79 upregulated and 132 downregulated) and 49 DE miRNAs (22 up-regulated and 27 down-regulated). Gene Set enrichment analysis identified the enrichment of a set of MYC regulated genes. Network propagation-based method and correlated miRNA-mRNA expression analysis identified dysregulated miRNAs, including miR-17~95 cluster members and their target genes, which have diverse oncogenic properties to be critical to eBL lymphomagenesis. Central to all these findings, we observed the downregulation of ATM and NLK genes, which represent important regulators in response to DNA damage in eBL tumor cells. These tumor suppressors were targeted by multiple upregulated miRNAs (miR-19b-3p, miR-26a-5p, miR-30b-5p, miR-92a-5p and miR-27b-3p) which could account for their aberrant expression in eBL.
Conclusion: Combined loss of p53 induction and function due to miRNA-mediated regulation of ATM and NLK, together with the upregulation of TFAP4, may be a central role for human miRNAs in eBL oncogenesis. This facilitates survival of eBL tumor cells with the IGH/MYC chromosomal translocation and promotes MYC-induced cell cycle progression, initiating eBL lymphomagenesis. This characterization of miRNA-mRNA interactions in eBL relative to GC B cells provides new insights on miRNA-mediated transcript regulation in eBL, which are potentially useful for new improved therapeutic strategies.
Keywords: Endemic Burkitt lymphoma; Lymphomagenesis; RNA sequencing; mRNA; miRNA.
Conflict of interest statement
Ethics approval and consent to participate
Ethical review and approval for this study was obtained from the Institutional Review Board at the University of Massachusetts Medical School, USA and the Scientific and Ethics Review Unit (SERU) at the Kenya Medical Research Institute (KEMRI), Kenya. Parents and legal guardians of the study participants provided written informed consent.
Consent for publication
Not applicable.
Competing interests
The authors declare that they have no competing interests.
Publisher’s Note
Springer Nature remains neutral with regard to jurisdictional claims in published maps and institutional affiliations.
Figures


Similar articles
-
Human and Epstein-Barr Virus miRNA Profiling as Predictive Biomarkers for Endemic Burkitt Lymphoma.Front Microbiol. 2017 Mar 28;8:501. doi: 10.3389/fmicb.2017.00501. eCollection 2017. Front Microbiol. 2017. PMID: 28400759 Free PMC article.
-
Burkitt lymphoma beyond MYC translocation: N-MYC and DNA methyltransferases dysregulation.BMC Cancer. 2015 Oct 9;15:668. doi: 10.1186/s12885-015-1661-7. BMC Cancer. 2015. PMID: 26453442 Free PMC article.
-
Alteration of microRNAs regulated by c-Myc in Burkitt lymphoma.PLoS One. 2010 Sep 24;5(9):e12960. doi: 10.1371/journal.pone.0012960. PLoS One. 2010. PMID: 20930934 Free PMC article.
-
Regulation of the MIR155 host gene in physiological and pathological processes.Gene. 2013 Dec 10;532(1):1-12. doi: 10.1016/j.gene.2012.12.009. Epub 2012 Dec 14. Gene. 2013. PMID: 23246696 Review.
-
Expanding the immune-related targetome of miR-155-5p by integrating time-resolved RNA patterns into miRNA target prediction.RNA Biol. 2025 Dec;22(1):1-9. doi: 10.1080/15476286.2025.2449775. Epub 2025 Jan 11. RNA Biol. 2025. PMID: 39760255 Free PMC article. Review.
Cited by
-
Epigenetic Silencing of MicroRNA-126 Promotes Cell Growth in Marek's Disease.Microorganisms. 2021 Jun 21;9(6):1339. doi: 10.3390/microorganisms9061339. Microorganisms. 2021. PMID: 34205549 Free PMC article.
-
MicroRNA and Other Non-Coding RNAs in Epstein-Barr Virus-Associated Cancers.Cancers (Basel). 2021 Aug 3;13(15):3909. doi: 10.3390/cancers13153909. Cancers (Basel). 2021. PMID: 34359809 Free PMC article. Review.
-
MiR-378a-3p Is Critical for Burkitt Lymphoma Cell Growth.Cancers (Basel). 2020 Nov 27;12(12):3546. doi: 10.3390/cancers12123546. Cancers (Basel). 2020. PMID: 33261009 Free PMC article.
-
MicroRNAs as Biomarkers of B-cell Lymphoma.Biomark Insights. 2018 Oct 16;13:1177271918806840. doi: 10.1177/1177271918806840. eCollection 2018. Biomark Insights. 2018. PMID: 30349178 Free PMC article. Review.
-
Targeted chitosan nanobubbles as a strategy to down-regulate microRNA-17 into B-cell lymphoma models.Front Immunol. 2023 Jun 8;14:1200310. doi: 10.3389/fimmu.2023.1200310. eCollection 2023. Front Immunol. 2023. PMID: 37359561 Free PMC article.
References
-
- Burkitt D, O’Conor GT. Malignant lymphoma in African children. I A clinical syndrome Cancer. 1961;14:258–269. - PubMed
-
- Epstein MA. Historical background; Burkitt’s lymphoma and Epstein-Barr virus. IARC Sci Publ. 1985:17–27. - PubMed
-
- Moormann A, Skiles J, Otieno J, Buckle G, Vik T. Optimal management of endemic Burkitt lymphoma: a holistic approach mindful of limited resources. BLCTT. 2014;91
MeSH terms
Substances
Grants and funding
LinkOut - more resources
Full Text Sources
Other Literature Sources
Molecular Biology Databases
Research Materials
Miscellaneous
