. 2017 Nov 13;16(1):171.
doi: 10.1186/s12943-017-0737-1.

Knockdown of SOX2OT inhibits the malignant biological behaviors of glioblastoma stem cells via up-regulating the expression of miR-194-5p and miR-122

Affiliations

Knockdown of SOX2OT inhibits the malignant biological behaviors of glioblastoma stem cells via up-regulating the expression of miR-194-5p and miR-122

Rui Su et al. Mol Cancer. .

Erratum in

Abstract

Background: Accumulating evidence has highlighted the potential role of long non-coding RNAs (lncRNAs) in the biological behaviors of glioblastoma stem cells (GSCs). Here, we elucidated the function and possible molecular mechanisms of the effect of lncRNA-SOX2OT on the biological behaviors of GSCs.

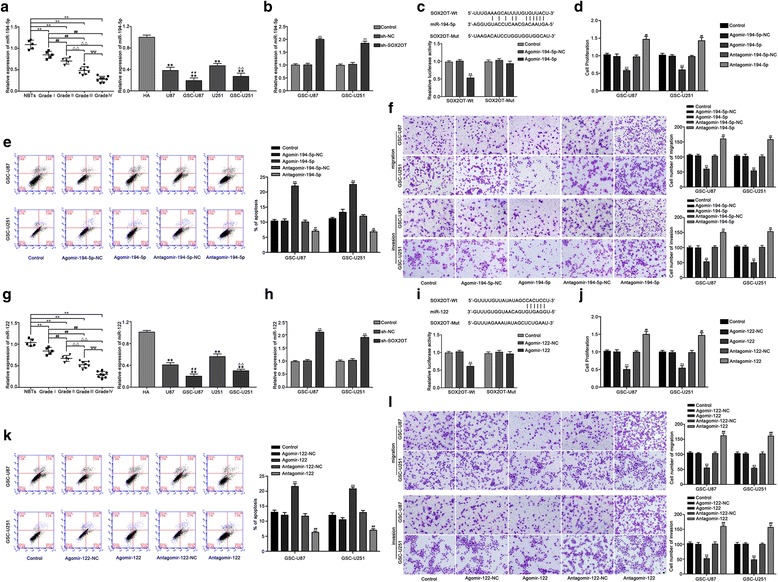
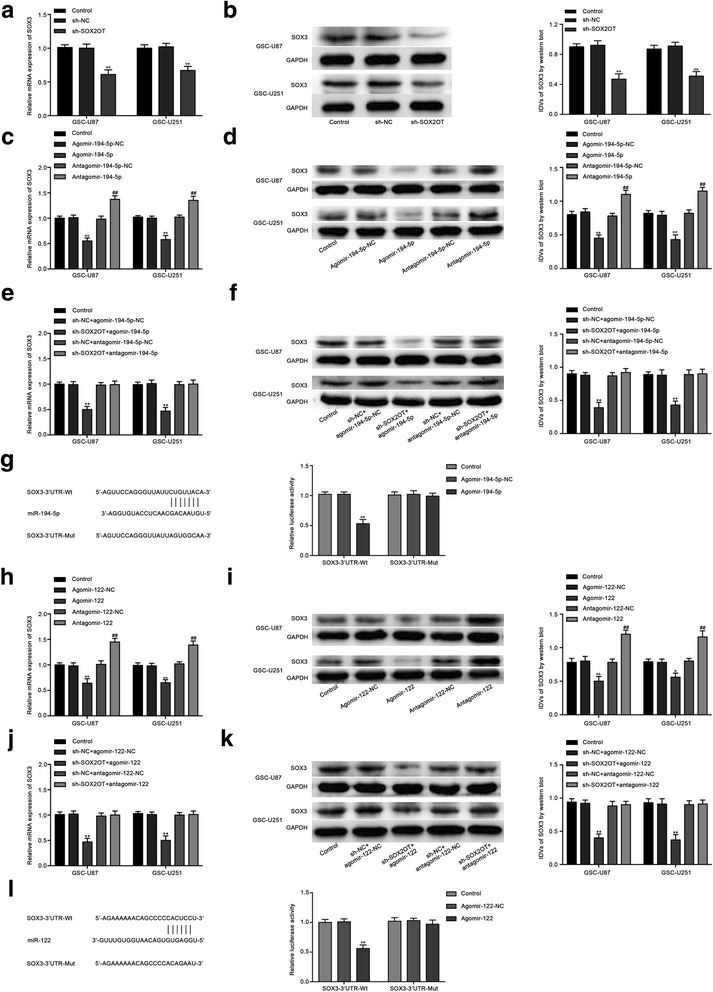
Results: Real-time PCR demonstrated that SOX2OT expression was up-regulated in glioma tissues and GSCs. Knockdown of SOX2OT inhibited the proliferation, migration and invasion of GSCs, and promoted GSCs apoptosis. MiR-194-5p and miR-122 were down-regulated in human glioma tissues and GSCs, and miR-194-5p and miR-122 respectively exerted tumor-suppressive functions by inhibiting the proliferation, migration and invasion of GSCs, while promoting GSCs apoptosis. Knockdown of SOX2OT significantly increased the expression of miR-194-5p and miR-122 in GSCs. Dual-luciferase reporter assay revealed that SOX2OT bound to both miR-194-5p and miR-122. SOX3 and TDGF-1 were up-regulated in human glioma tissues and GSCs. Knockdown of SOX3 inhibited the proliferation, migration and invasion of GSCs, promoted GSCs apoptosis, and decreased TDGF-1 mRNA and protein expression through direct binding to the TDGF-1 promoter. Over-expression of miR-194-5p and miR-122 decreased the mRNA and protein expression of SOX3 by targeting its 3'UTR. Knockdown of TDGF-1 inhibited the proliferation, migration and invasion of GSCs, promoted GSCs apoptosis, and inhibited the JAK/STAT signaling pathway. Furthermore, SOX3 knockdown also inhibited the SOX2OT expression through direct binding to the SOX2OT promoter and formed a positive feedback loop.

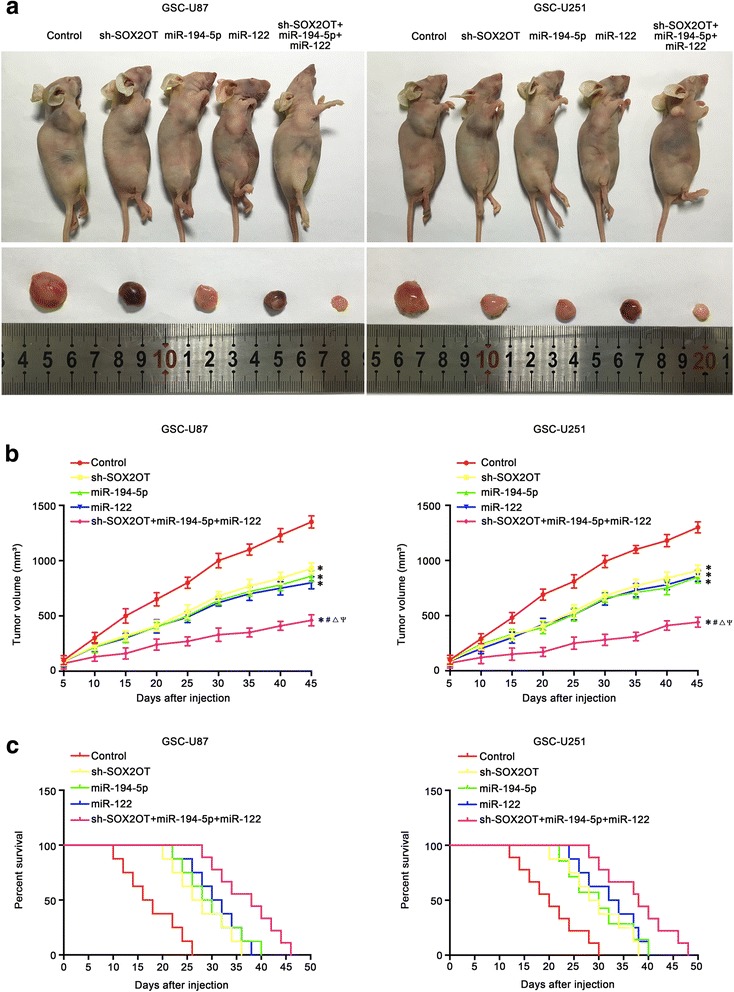
Conclusion: This study is the first to demonstrate that the SOX2OT-miR-194-5p/miR-122-SOX3-TDGF-1 pathway forms a positive feedback loop and regulates the biological behaviors of GSCs, and these findings might provide a novel strategy for glioma treatment.

Keywords: Glioma; SOX2OT; SOX3; TDGF-1; miR-122; miR-194-5p.


Conflict of interest statement

Competing interests

The authors declare that they have no competing interests.

Publisher’s Note

Springer Nature remains neutral with regard to jurisdictional claims in published maps and institutional affiliations.

Figures

Fig. 1
Fig. 1
The SOX2OT expression and effects of SOX2OT in glioma. a The expression of SOX2OT in normal brain tissues (NBTs) and glioma tissues of different grades. Data are presented as the mean ± SD (NBTs (n = 5), Grade I(n = 5),Grade II(n = 5), Grade III (n = 8), Grade IV (n = 8)). ** P < 0.01 vs. NBTs group; ## P < 0.01 vs. Grade I group; △△ P < 0.01 vs. Grade II group; ΨΨ P < 0.01 vs. Grade III group. b The expression of SOX2OT in human astrocytes (HA), glioblastoma cell lines (U87 and U251) and glioblastoma stem cells (GSC-U87, GSC-U251). Data are presented as the mean ± SD (n = 5, each group). ** P < 0.01 vs. HA group; ## P < 0.01 vs. U87 group; ΨΨ P < 0.01 vs. U251 group. c The expression of SOX2OT after cells transfection with sh-SOX2OT plasmids. d CCK-8 assay was used to measure the effect of SOX2OT on the proliferation of GSC-U87 and GSC-U251. e The apoptotic percentages of GSC-U87 and GSC-U251 were detected after SOX2OT knockdown. f Transwell assays were used to measure the effect of SOX2OT on cell migration and invasion of GSC-U87 and GSC-U251. Data represent as the mean ± SD (n = 5,each group). ** P < 0.01 vs. sh-NC group. Scale bars represent 40 μm
Fig. 2
Fig. 2
MiR-194-5p and miR-122 exerted tumor-suppressive functions in GSCs. a The expression of miR-194-5p in normal brain tissues (NBTs) and glioma tissues of different grades. Data are presented as the mean ± SD (NBTs (n = 5), Grade I (n = 5), Grade II (n = 5), Grade III (n = 8), Grade IV (n = 8)). ** P < 0.01 vs. NBTs group; ## P < 0.01 vs. Grade I group; △△ P < 0.01 vs. Grade II group; ΨΨ P < 0.01 vs. Grade III group. The expression of miR-194-5p in human astrocytes (HA), glioblastoma cell lines (U87 and U251) and glioblastoma stem cells (GSC-U87, GSC-U251). Data are presented as the mean ± SD (n = 5,each group). ** P < 0.01 vs. HA group; ## P < 0.01 vs. U87 group; △△ P < 0.01 vs. U251 group. b The expression of miR-194-5p after SOX2OT knockdown in GSC-U87 and GSC-U251 cells. ** P < 0.01 vs. sh-NC group. c The predicted miR-194-5p binding site in the SOX2OT sequence (SOX2OT-Wt) and the designed mutant sequence of miR-194-5p binding site (SOX2OT-Mut) are indicated. Relative luciferase activity was conducted after cells were transfected with SOX2OT-Wt or SOX2OT-Mut. Data were presented as the mean ± SD (n = 5, each group). ** P < 0.01 vs. SOX2OT-Wt + Agomir-194-5p-NC. d CCK-8 assay was used to measure the effect of miR-194-5p on the proliferation of GSC-U87 and GSC-U251 cells. e The apoptotic percentages of GSC-U87 and GSC-U251 cells were detected after miR-194-5p over-expression or inhibition. f Transwell assays was used to measure the effect of miR-194-5p on the migration and invasion of GSC-U87 and GSC-U251 cells. Scale bars represent 40 μm. Data are presented as the mean ± SD (n = 5, each group).** P < 0.01 vs. Agomir-194-5p-NC group; ## P < 0.01 vs. Antagomir-194-5p-NC group. g The expression of miR-122 in normal brain tissues(NBTs) and glioma tissues of different grades. Data are presented as the mean ± SD (NBTs (n = 5), Grade I (n = 5), Grade II(n = 5), Grade III (n = 8), Grade IV (n = 8)). ** P < 0.01 vs. NBTs group; ## P < 0.01 vs. Grade I group; △△ P < 0.01 vs. Grade II group; ΨΨ P < 0.01 vs. Grade III group. The expression of miR-122 in HA cells, glioblastoma cell lines(U87 and U251) and glioblastoma stem cells (GSC-U87, GSC-U251). Data are presented as the mean ± SD (n = 5,each group). ** P < 0.01 vs. HA group; ## P < 0.01 vs. U87 group; △△ P < 0.01 vs. U251 group. h The expression of miR-122 with SOX2OT knockdown in GSC-U87 and GSC-U251 cells. ** P < 0.01 vs. sh-NC group. i The predicted miR-122 binding sites in the SOX2OT sequence (SOX2OT-Wt) and the designed mutant sequence of miR-122 binding site (SOX2OT-Mut) are indicated. Relative luciferase activity was conducted after cells were transfected with SOX2OT-Wt or SOX2OT-Mut. Data were presented as the mean ± SD (n = 5, each group). ** P < 0.01 vs. SOX2OT-Wt + Agomir-122-NC. j CCK-8 assay was used to measure the effect of miR-122 on the proliferation of GSC-U87 and GSC-U251 cells. k The apoptotic percentages of GSC-U87 and GSC-U251 cells were detected after miR-122 over-expression or inhibition. l Transwell assays were used to measure the effect of miR-122 on the migration and invasion of GSC-U87 and GSC-U251 cells. Scale bars represent 40 μm. Data are presented as the mean ± SD (n = 5, each group). ** P < 0.01 vs. Agomir-122-NC group; ## P < 0.01 vs. Antagomir-122-NC group
Fig. 3
Fig. 3
MiR-194-5p and miR-122 mediated the tumor-suppressive effects of SOX2OT knockdown on GSCs. a CCK-8 assay was used to measure the effect of SOX2OT and miR-194-5p on the proliferation of GSC-U87 and GSC-U251 cells. b Flow cytometry analysis to evaluate the effect of SOX2OT and miR-194-5p on the apoptosis of GSC-U87 and GSC-U251 cells. c Transwell assays was used to measure the effect of SOX2OT and miR-194-5p on the migration and invasion of GSC-U87 and GSC-U251 cells. Data are presented as the mean ± SD (n = 5, each group).** P < 0.01 vs. sh-NC + agomir-194-5p-NC. d CCK-8 assay was used to measure the effect of SOX2OT and miR-122 on the proliferation of GSC-U87 and GSC-U251 cells. e Flow cytometry analysis to evaluate the effect of SOX2OT and miR-122 on the apoptosis of GSC-U87 and GSC-U251 cells. f Transwell assays was used to measure the effect of SOX2OT and miR-122 on the migration and invasion of GSC-U87 and GSC-U251 cells. Scale bars represent 40 μm. Data are presented as the mean ± SD (n = 5,each group) . ** P < 0.01 vs. sh-NC + agomir-122-NC
Fig. 4
Fig. 4
SOX3 endogenous expression and its effect on the proliferation, migration, invasion and apoptosis in GSCs, as well as the expression of SOX2OT and TDGF-1. a The SOX3 protein expression levels in normal brain tissues (NBTs), low-grade glioma tissues (WHO I-II) and high-grade glioma tissues (WHO III-IV) are shown. Data are presented as the mean ± SD (n = 3,each group). ** P < 0.01 vs. NBTs group; ## P < 0.01 vs. low-grade glioma tissues group. bThe expression level of SOX3 in human astrocytes (HA) and glioblastoma cell lines (U87 and U251). c The expression of SOX3 in glioblastoma cell lines (U87 and U251) and glioblastoma stem cells (GSC-U87, GSC-U251). d CCK-8 assay was used to measure the effect of SOX3 on the proliferation of GSC-U87 and GSC-U251 cells. e The apoptotic percentages of GSC-U87 and GSC-U251 were detected after SOX3 over-expression or knockdown. f Transwell assays was used to measure the effect of SOX3 on cell migration and invasion of GSC-U87 and GSC-U251 cells. Scale bars represent 40 μm. Data are presented as the mean ± SD (n = 5, each group). ** P < 0.01 vs. SOX3(+)NC group; ## P < 0.01 vs. SOX3(−)NC group. g Relative expression of SOX2OT with the over-expressing or silencing SOX3. h SOX3 bound to the promoter of SOX2OT in GSC-U87 and GSC-U251 cells. Schematic representation of the human SOX2OT promoter region 3000 bp upstream of the transcription start site (TSS), which was designated as +1. Putative SOX3 binding site was indicated. PCR was conducted with the resulting precipitated DNA. i Weatern blot assay was used to detect the expression of TDGF-1 after SOX3 over-expression or knockdown. j SOX3 bound to the promoter of TDGF-1 in GSC-U87 and GSC-U251 cells. Schematic representation of the human TDGF-1 promoter region 3000 bp upstream of the transcription start site (TSS), which was designated as +1. Putative SOX3 binding site was indicated. PCR was conducted with the resulting precipitated DNA
Fig. 5
Fig. 5
The SOX3 expression regulated by SOX2OT, miR-194-5p and miR-122. a Real-time PCR and (b) Weatern blot assay were used to detect the SOX3 expression after SOX2OT knockdown. c Real-time PCR and (d) Weatern blot assay were used to detect the SOX3 expression after miR-194-5p over-expression or knockdown. e Real-time PCR and (f) Weatern blot assay were used to detect the SOX3 expression regulated by SOX2OT and miR-194-5p. g The predicted miR-194-5p binding sites in the 3’UTR region of SOX3 (SOX3–3’UTR-Wt) and the designed mutant sequence (SOX3–3’UTR-Mut) are indicated. Relative luciferase activity was conducted after cells were transfected with SOX3–3’UTR-Wt or SOX3–3’UTR-Mut. Data were presented as the mean ± SD (n = 5,each group).** P < 0.01 vs. SOX3–3’UTR-Wt + Agomir-194-5p-NC group. h Real-time PCR and (i) Weatern blot assay were used to detect the SOX3 expression after miR-122 over-expression or knockdown. j Real-time PCR and (k)Weatern blot assay were used to detect the SOX3 expression regulated by SOX2OT and miR-122. l The predicted miR-122 binding sites in the 3’UTR region of SOX3 (SOX3–3’UTR-Wt) and the designed mutant sequence (SOX3–3’UTR-Mut) are indicated. Data were presented as the mean ± SD (n = 5,each group). ** P < 0.01 vs. SOX3–3’UTR-Wt + Agomir-122-NC group
Fig. 6
Fig. 6
SOX3 mediated tumor-suppressive effects of miR-194-5p and miR-122. a CCK8 assay to evaluate the effect of miR-194-5p and SOX3 on cell proliferation of GSC-U87 and GSC-U251 cells. b Flow cytometry analysis to evaluate the effect of miR-194-5p and SOX3 on cell apoptosis of GSC-U87 and GSC-U251 cells. c Transwell assay to evaluate the effect of miR-194-5p and SOX3 on the cell migration and invasion of GSC-U87 and GSC-U251 cells. Data are presented as the mean ± SD (n = 5, each group). Scale bars represent 40 μm. ** P < 0.01 vs. AgomiR-194-5p-NC + SOX3(+)NC group, ## P < 0.01 vs. AgomiR-194-5p + SOX3(+)NC group. d CCK8 assay to evaluate the effect of miR-122 and SOX3 on cell proliferation of GSC-U87 and GSC-U251 cells. e Flow cytometry analysis to evaluate the effect of miR-122 and SOX3 on cell apoptosis of GSC-U87 and GSC-U251 cells. f Transwell assay to evaluate the effect of miR-122 and SOX3 on the cell migration and invasion of GSC-U87 and GSC-U251 cells. Data are presented as the mean ± SD (n = 5, each group). Scale bars represent 40 μm. ** P < 0.01 vs. AgomiR-122-NC + SOX3(+)NC group, ## P < 0.01 vs. AgomiR-122 + SOX3(+)NC group
Fig. 7
Fig. 7
TDGF-1 endogenous expression and effect on proliferation, migration, invasion and apoptosis of GSCs. a TDGF-1 protein expression levels in normal brain tissues (NBTs), low-grade glioma tissues (WHO I-II) and high-grade glioma tissues (WHO III-IV) are shown. Data are presented as the mean ± SD (n = 3,each group). b The expression of TDGF-1 in human astrocytes (HA) and glioblastoma cell lines (U87 and U251). c The expression of TDGF-1 in glioblastoma cell lines (U87 and U251) and glioblastoma stem cells (GSC-U87, GSC-U251). d CCK-8 assay was used to measure the effect of TDGF-1 on the proliferation of GSC-U87 and GSC-U251 cells. e The apoptotic percentages of GSC-U87 and GSC-U251 were detected after TDGF-1 over-expression or knockdown. f Transwell assays were used to measure the effect of TDGF-1 on cell migration and invasion of GSC-U87 and GSC-U251 cells. Data are presented as the mean ± SD (n = 5, each group). ** P < 0.01 vs. TDGF-1(+)NC, ## P < 0.01 vs. TDGF-1(−)NC. g Western blot assay of the p-JAK-1/JAK-1 and p-STAT3/STAT3 expression regulated by TDGF-1. Data are presented as the mean ± SD (n = 5, each group). ** P < 0.01 vs. TDGF-1(+)NC, ## P < 0.01 vs. TDGF-1(−)NC. h Weatern blot assay were used to detect the TDGF-1 expression regulated by miR-194-5p and SOX3. Data are presented as the mean ± SD (n = 5, each group). ** P < 0.01 vs. AgomiR-194-5p-NC + SOX3(+)NC group, ## P < 0.01 vs. AgomiR-194-5p + SOX3(+)NC group. i Weatern blot assay were used to detect the TDGF-1 expression regulated by miR-122 and SOX3. Data are presented as the mean ± SD (n = 5, each group). ** P < 0.01 vs. AgomiR-122-NC + SOX3(+)NC group, ## P < 0.01 vs. AgomiR-122 + SOX3(+)NC group
Fig. 8
Fig. 8
Tumor xenograft studies. a The nude mice carrying tumors from respective groups were shown. The sample tumors from respective group were shown. b Tumor growth curves were shown. Tumor volume was calculated every 5 days after injection, and the tumor was taken after 45 days. c Survival curves from representive nude mice injected into the right striatum were shown (n = 8, each group)
Fig. 9
Fig. 9
The schematic diagram of the oncogenic role of SOX2OT in GSCs

Similar articles

Cited by

References

    1. Gagliardi F, Narayanan A, Reni M, Franzin A, Mazza E, Boari N, Bailo M, Zordan P, Mortini P. The role of CXCR4 in highly malignant human gliomas biology: current knowledge and future directions. Glia. 2014;62:1015–1023. doi: 10.1002/glia.22669. - DOI - PubMed
    1. Zhou S, Ding F, Gu X. Non-coding RNAs as emerging regulators of neural injury responses and regeneration. Neurosci Bull. 2016;32:253–264. doi: 10.1007/s12264-016-0028-7. - DOI - PMC - PubMed
    1. Safdie F, Brandhorst S, Wei M, Wang W, Lee C, Hwang S, Conti PS, Chen TC, Longo VD. Fasting enhances the response of glioma to chemo- and radiotherapy. PLoS One. 2012;7:e44603. doi: 10.1371/journal.pone.0044603. - DOI - PMC - PubMed
    1. Zhang L, Zhang Y. Tunneling nanotubes between rat primary astrocytes and C6 glioma cells alter proliferation potential of glioma cells. Neurosci Bull. 2015;31:371–378. doi: 10.1007/s12264-014-1522-4. - DOI - PMC - PubMed
    1. Li H, Li Z, YM X, Wu Y, KK Y, Zhang C, Ji YH, Ding G, Chen FX. Epigallocatechin-3-gallate induces apoptosis, inhibits proliferation and decreases invasion of glioma cell. Neurosci Bull. 2014;30:67–73. doi: 10.1007/s12264-013-1394-z. - DOI - PMC - PubMed

MeSH terms