

Theoretically proposed optimal frequency for ultrasound induced cartilage restoration
- PMID: 29132387
- PMCID: PMC5684760
- DOI: 10.1186/s12976-017-0067-4
Theoretically proposed optimal frequency for ultrasound induced cartilage restoration
Abstract
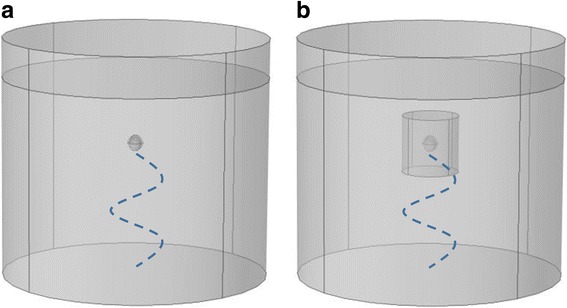
Background: Matching the frequency of the driving force to that of the system's natural frequency of vibration results in greater amplitude response. Thus we hypothesize that applying ultrasound at the chondrocyte's resonant frequency will result in greater deformation than applying similar ultrasound power at a frequency outside of the resonant bandwidth. Based on this resonant hypothesis, our group previously confirmed theoretically and experimentally that ultrasound stimulation of suspended chondrocytes at resonance (5 MHz) maximized gene expression of load inducible genes. However, this study was based on suspended chondrocytes. The resonant frequency of a chondrocyte does not only depend on the cell mass and intracellular stiffness, but also on the mechanical properties of the surrounding medium. An in vivo chondrocyte's environment differs whether it be a blood clot (following microfracture), a hydrogel or the pericellular and extracellular matrices of the natural cartilage. All have distinct structures and compositions leading to different resonant frequencies. In this study, we present two theoretical models, the first model to understand the effects of the resonant frequency on the cellular deformation and the second to identify the optimal frequency range for clinical applications of ultrasound to enhance cartilage restoration.
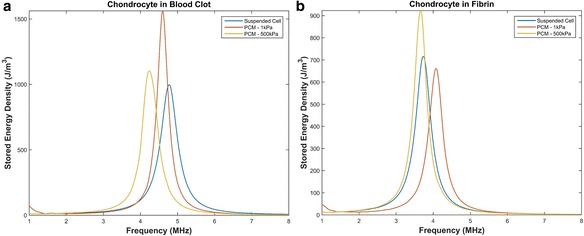
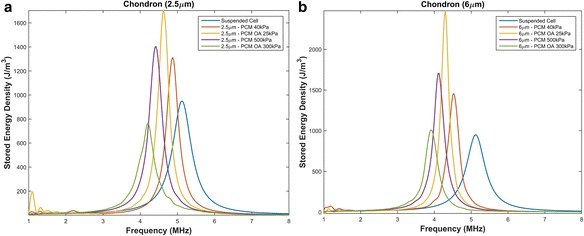
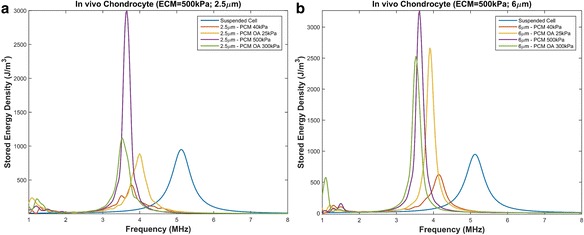
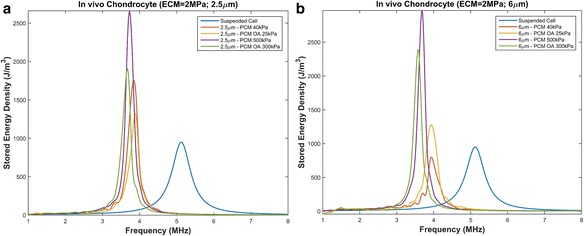
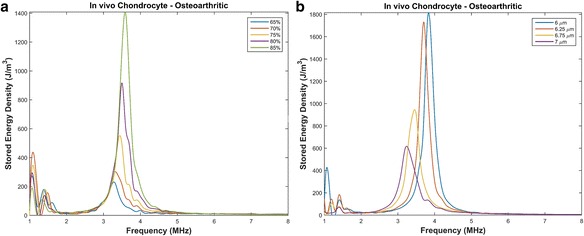
Results: We showed that applying low-intensity ultrasound at the resonant frequency induced deformation equivalent to that experimentally calculated in previous studies at higher intensities and a 1 MHz frequency. Additionally, the resonant frequency of an in vivo chondrocyte in healthy conditions, osteoarthritic conditions, embedded in a blood clot and embedded in fibrin ranges from 3.5 - 4.8 MHz.
Conclusion: The main finding of this study is the theoretically proposed optimal frequency for clinical applications of therapeutic ultrasound induced cartilage restoration is 3.5 - 4.8 MHz (the resonant frequencies of in vivo chondrocytes). Application of ultrasound in this frequency range will maximize desired bioeffects.
Keywords: Cellular deformation; Mechanical energy density; Resonant frequency.
Conflict of interest statement
Ethics approval and consent to participate
Not applicable.
Consent for publication
Not applicable.
Competing interests
The authors declare that they have no competing interests.
Publisher’s Note
Springer Nature remains neutral with regard to jurisdictional claims in published maps and institutional affiliations.
Figures
References
-
- Wang Q, Li Z, Fu Y, Wang Z, Wei M, Zhao B, et al. Effect of low-energy shock waves in microfracture holes in the repair of articular cartilage defects in a rabbit model. Chinese Medical Journal-Beijing. 2011;124(9):1386. - PubMed
-
- Knutsen G, Drogset JO, Engebretsen L, Grontvedt T, Ludvigsen TC, Loken S, et al. A Randomized Multicenter Trial Comparing Autologous Chondrocyte Implantation with Microfracture: Long-Term Follow-up at 14 to 15 Years. J Bone Joint Surg Am. 2016;98(16):1332–1339. doi: 10.2106/JBJS.15.01208. - DOI - PubMed
-
- Cole BJ, D'Amato M. Autologous chondrocyte implantation. Oper Tech Orthop. 2001;11(2):115–131. doi: 10.1016/S1048-6666(01)80021-5. - DOI
MeSH terms
LinkOut - more resources
Full Text Sources
Other Literature Sources
