. 2017 Nov 14:6:e30952.
doi: 10.7554/eLife.30952.

Transcriptomic and proteomic landscape of mitochondrial dysfunction reveals secondary coenzyme Q deficiency in mammals

Affiliations

Transcriptomic and proteomic landscape of mitochondrial dysfunction reveals secondary coenzyme Q deficiency in mammals

Inge Kühl et al. Elife. .

Abstract

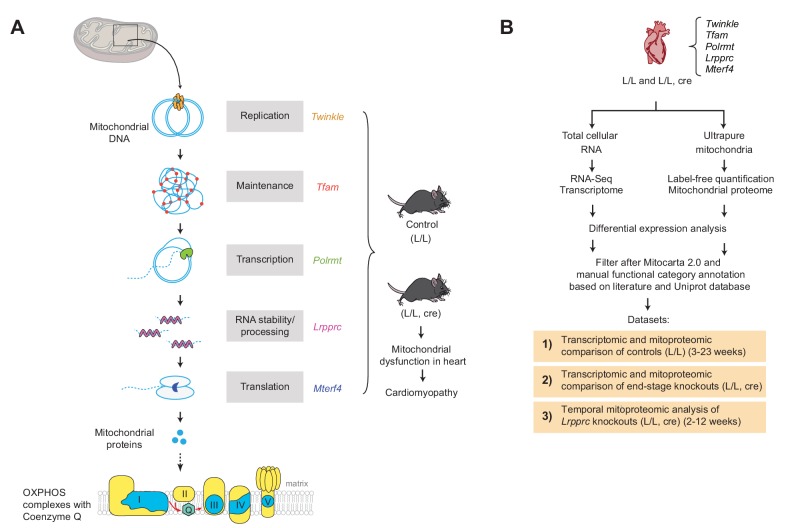
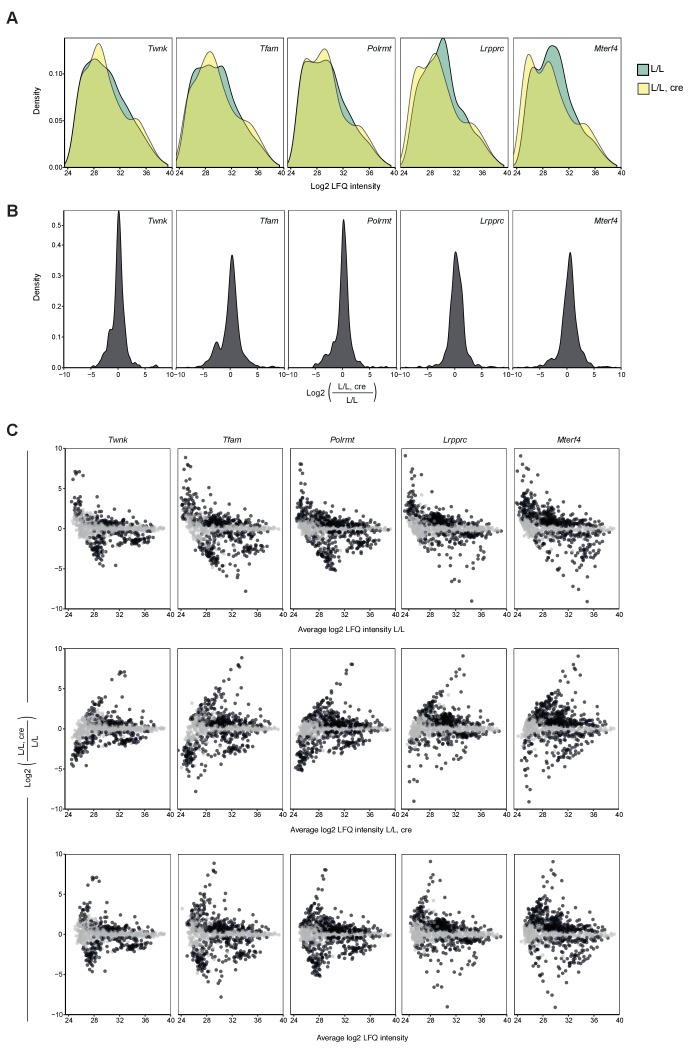
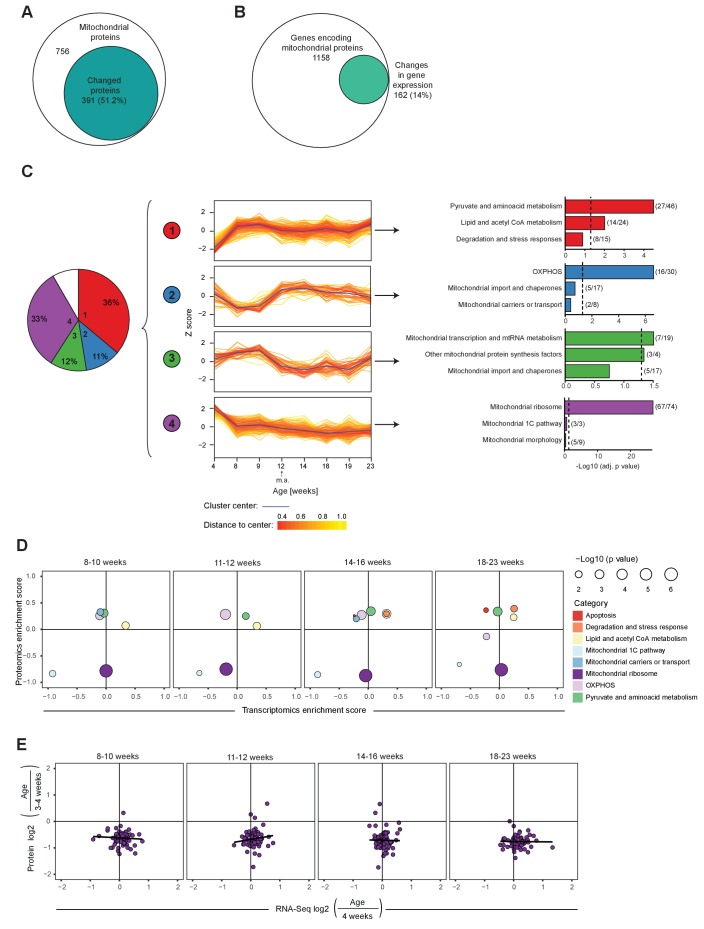
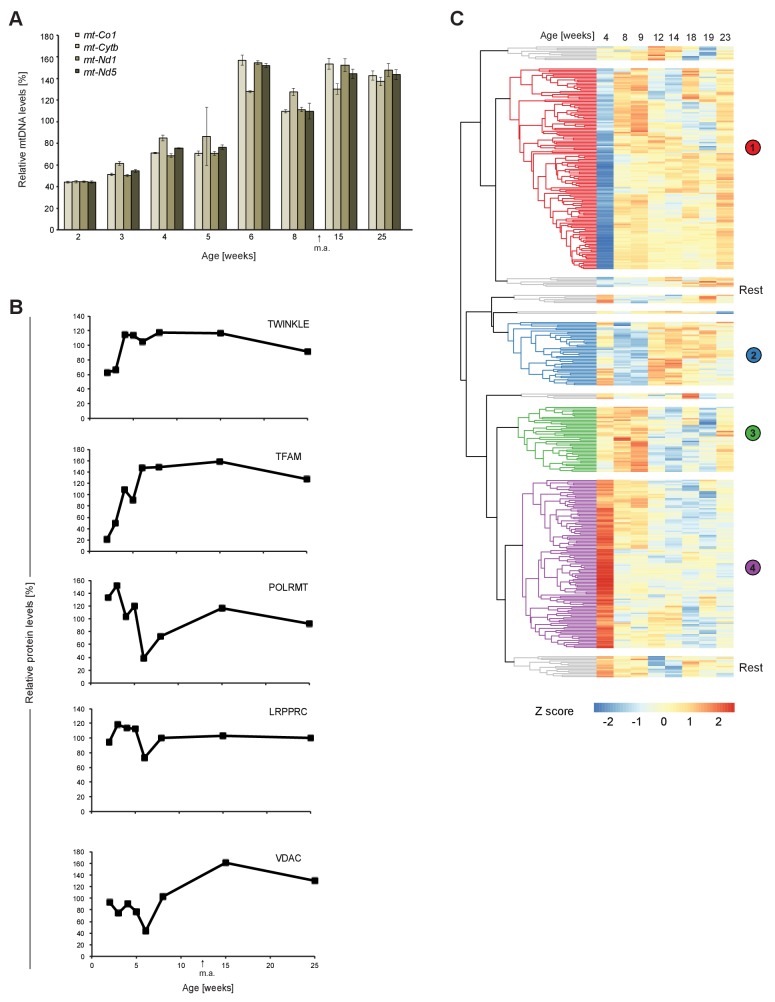
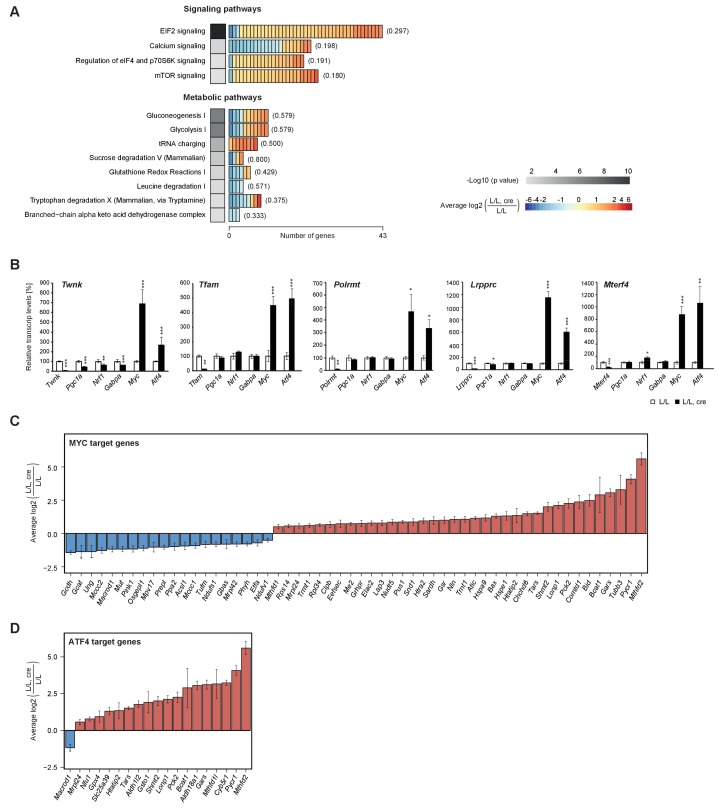
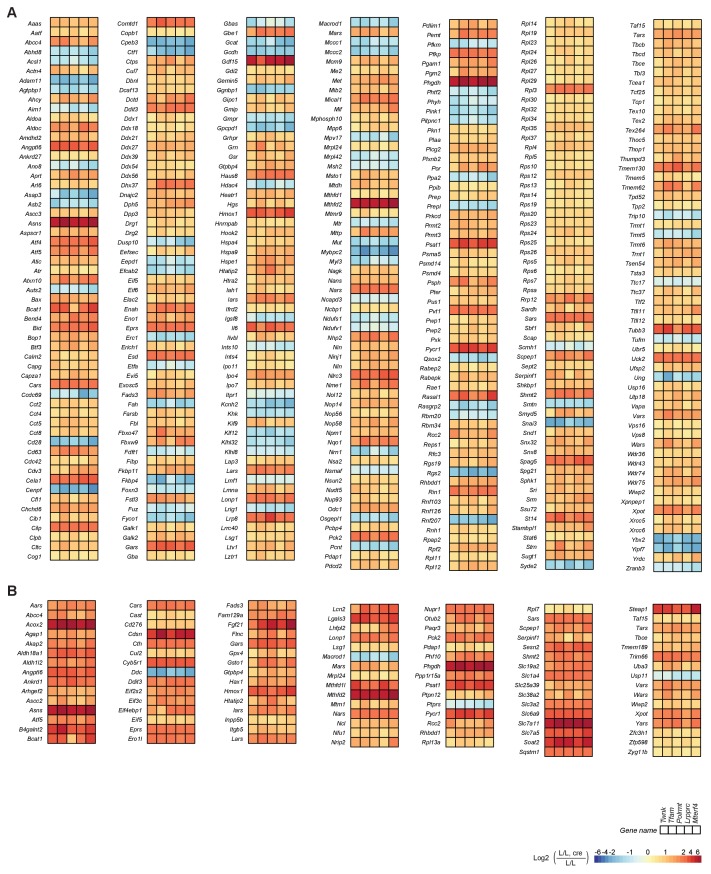
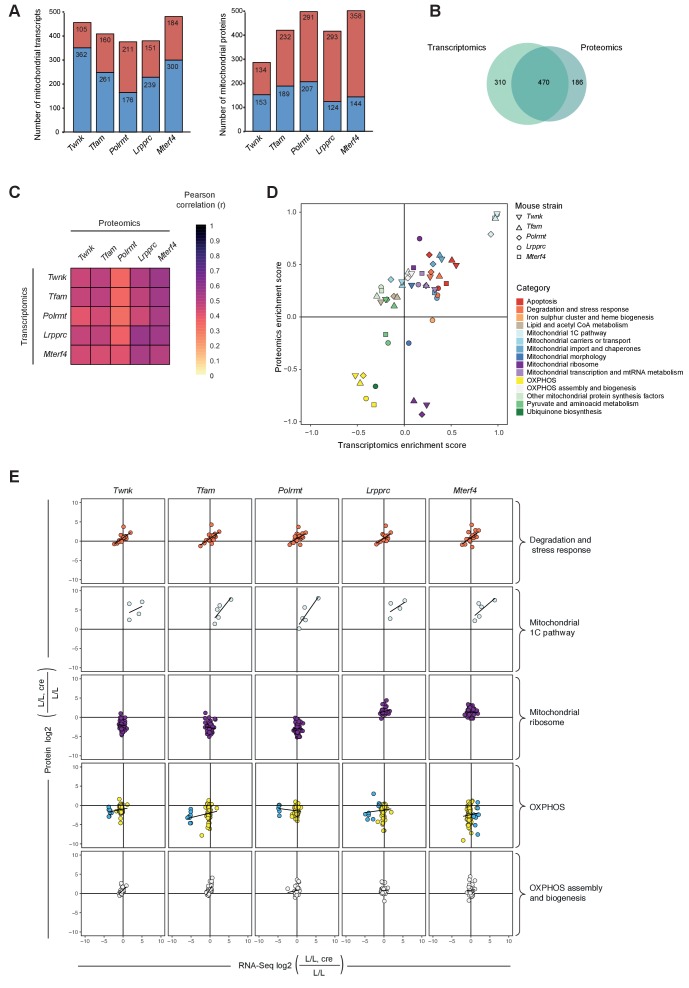
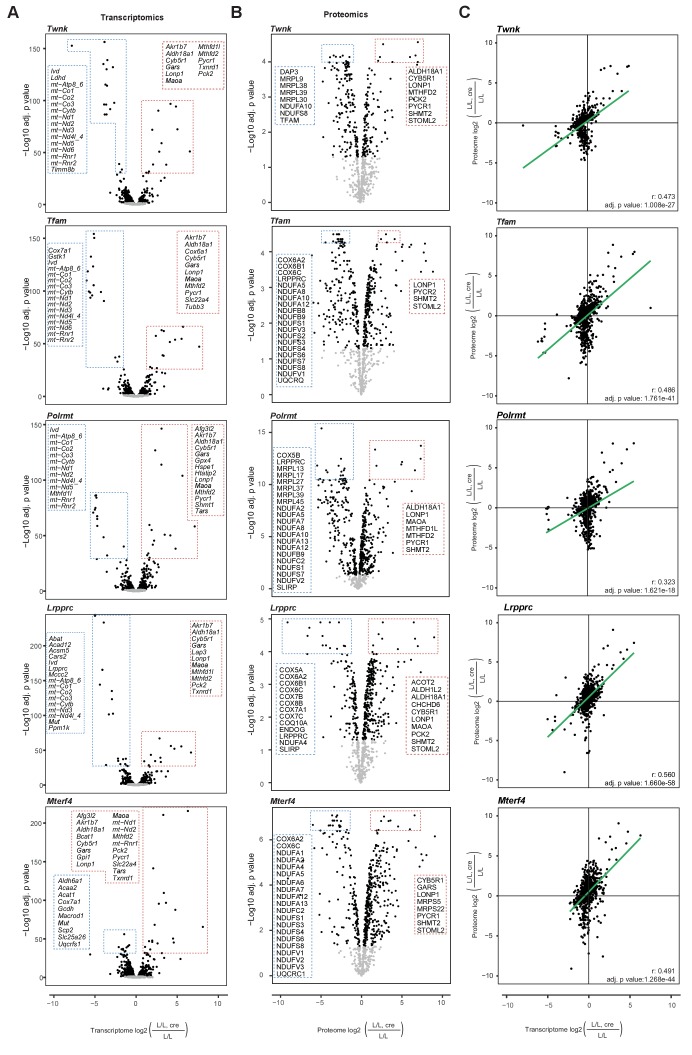
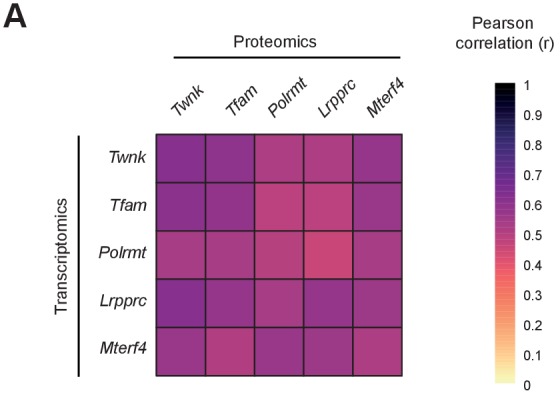
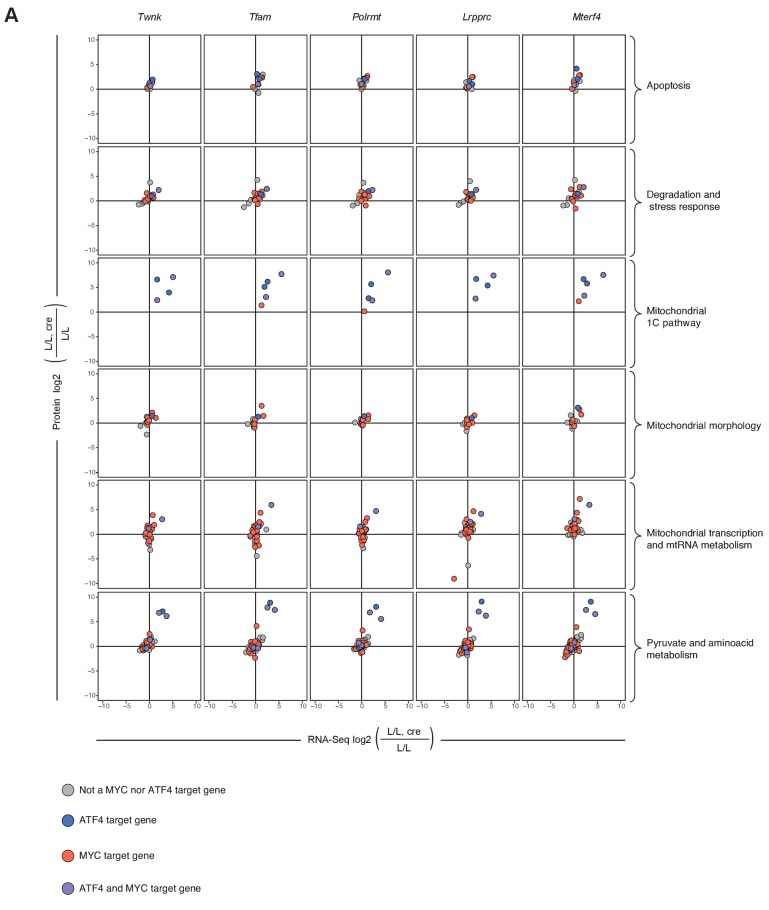
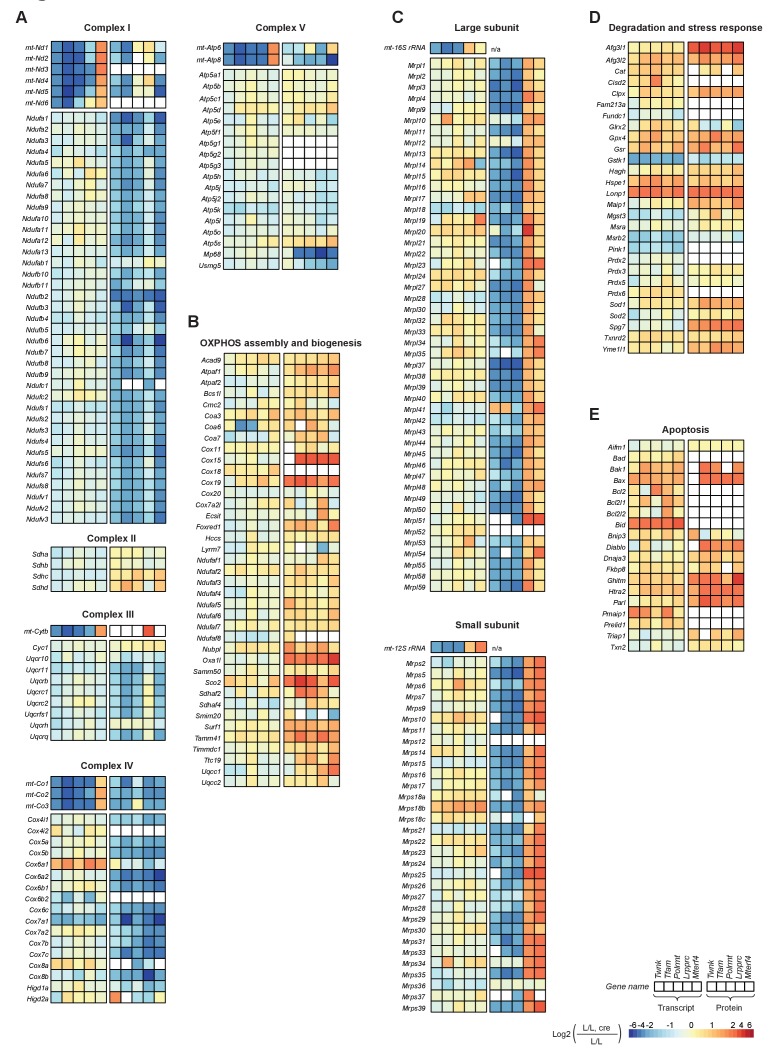
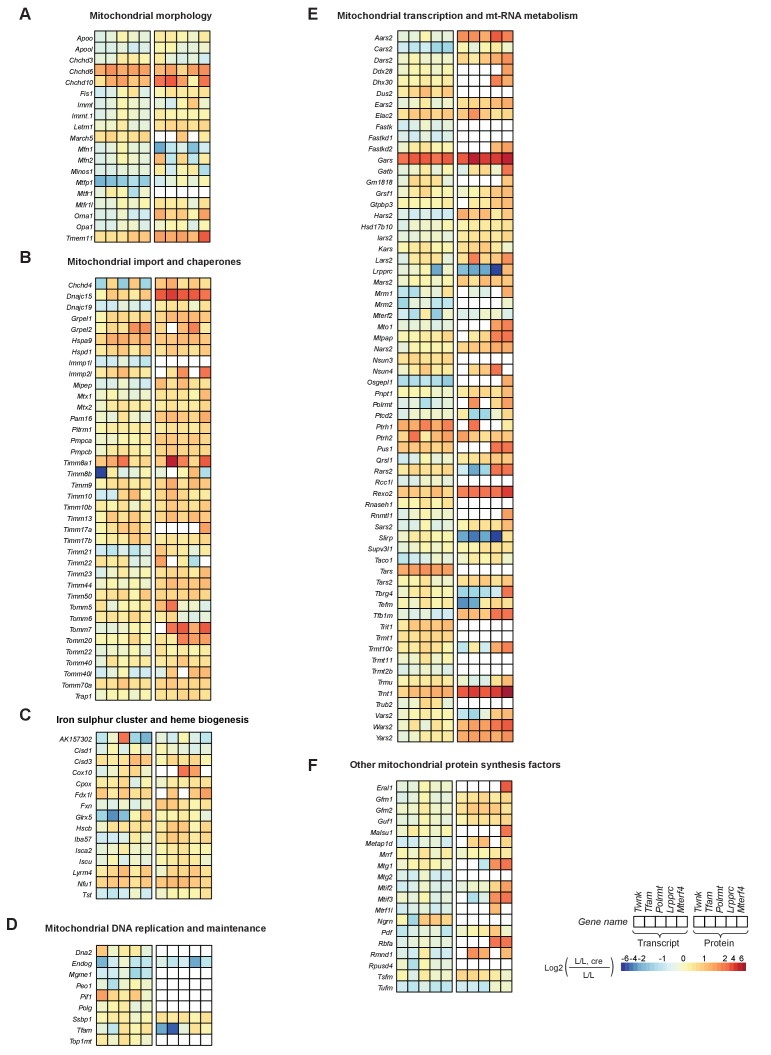
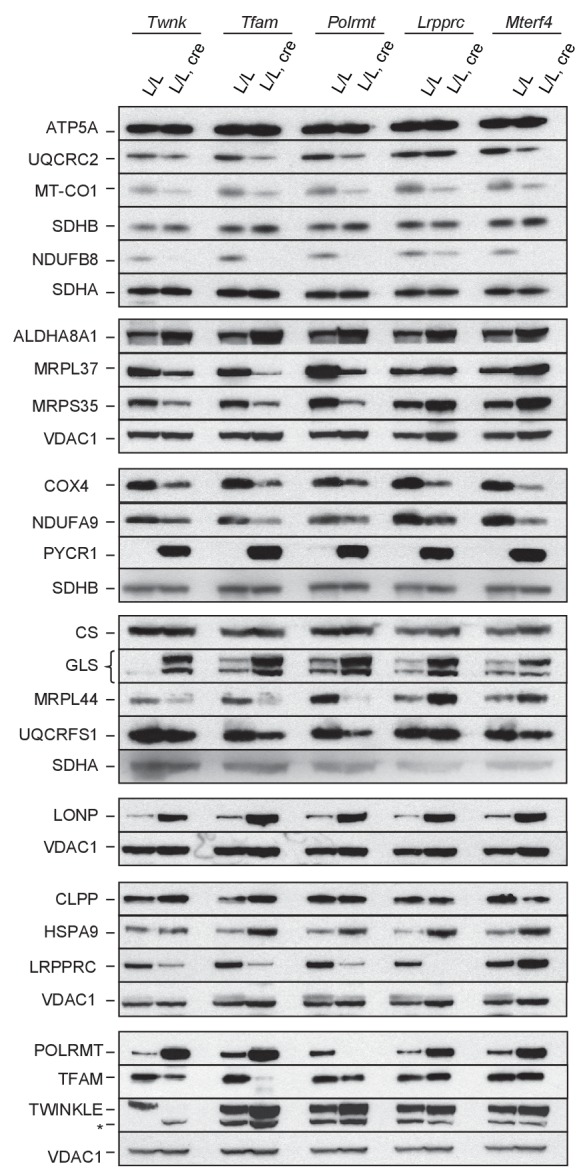
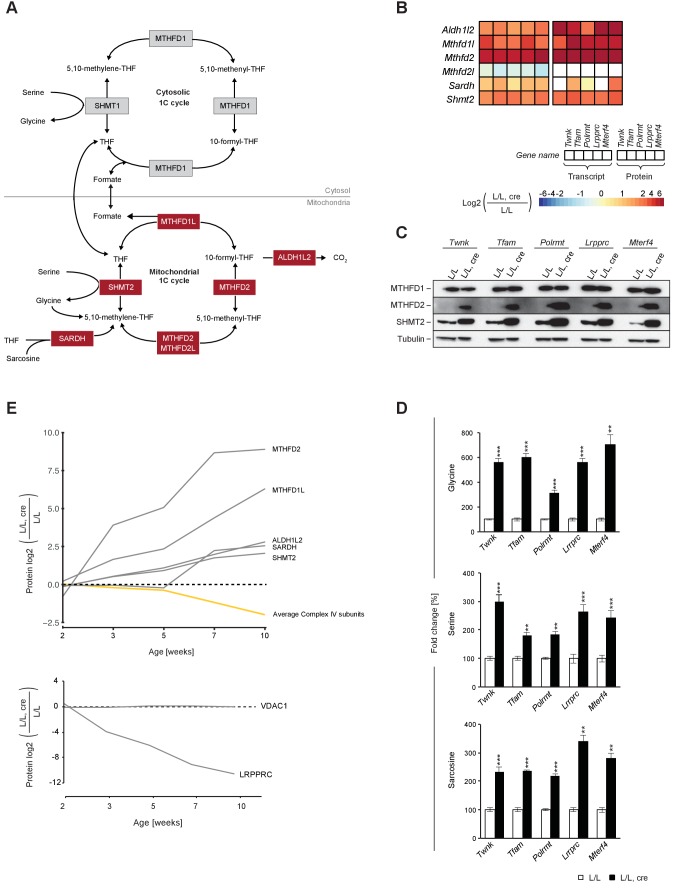
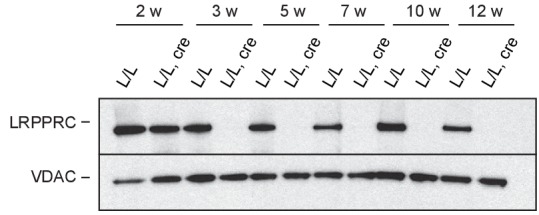
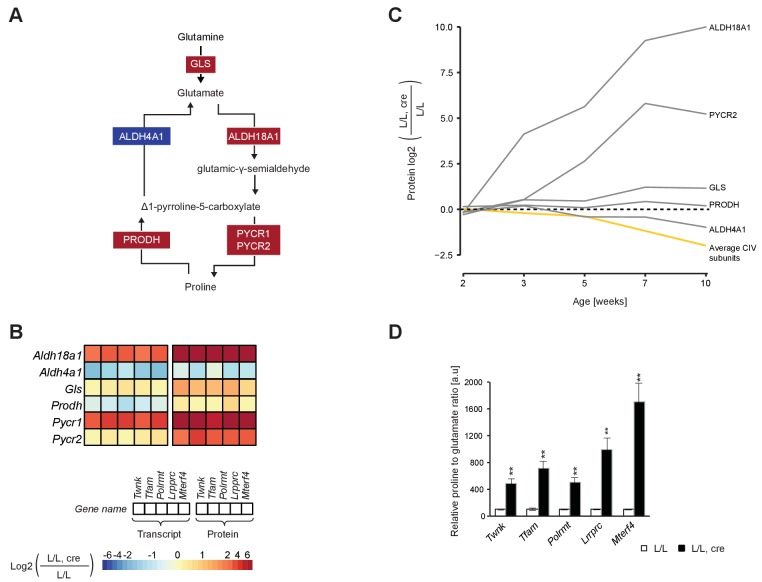
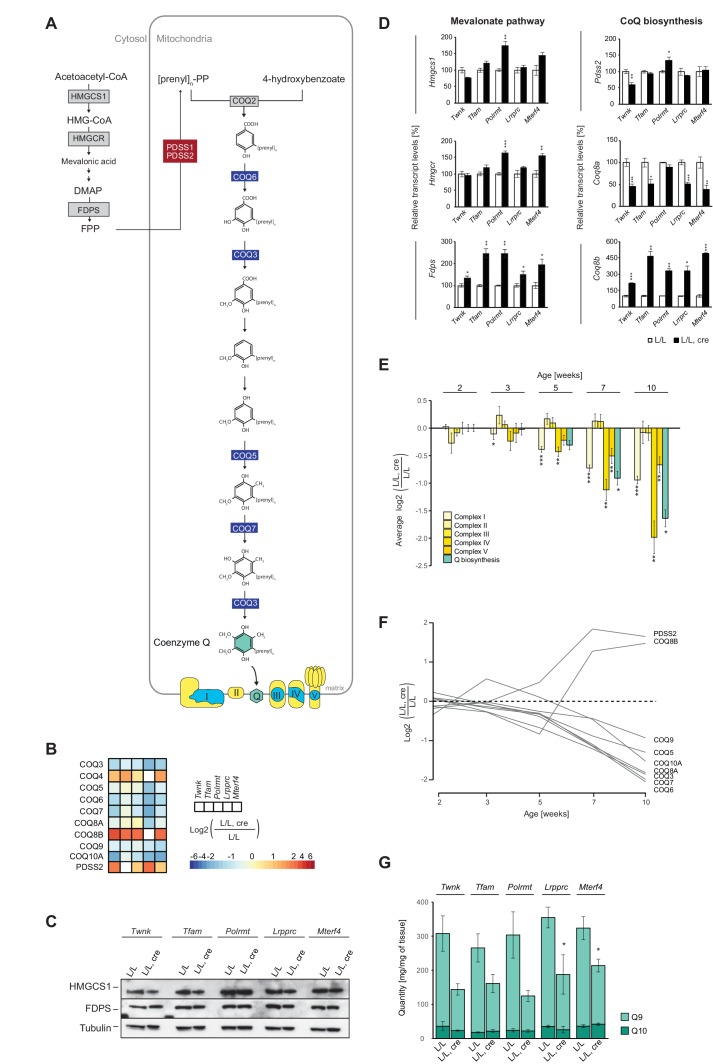
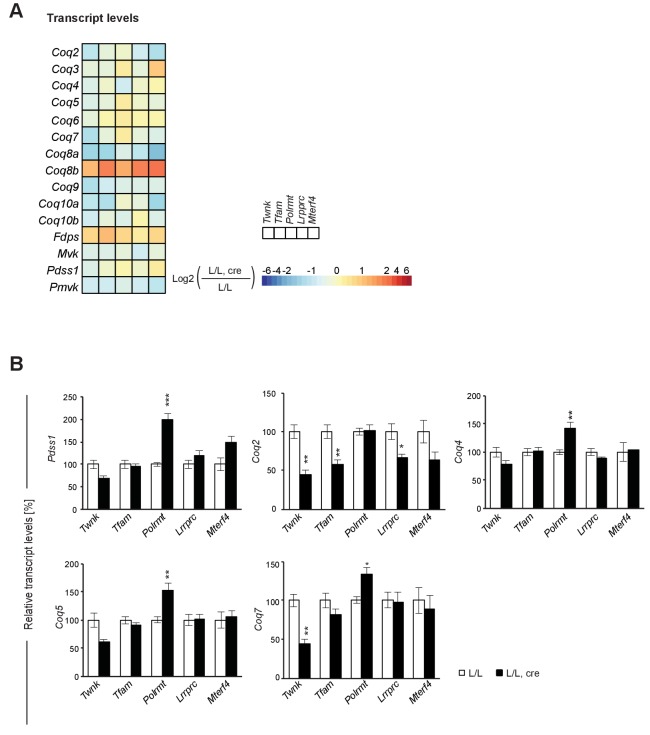
Dysfunction of the oxidative phosphorylation (OXPHOS) system is a major cause of human disease and the cellular consequences are highly complex. Here, we present comparative analyses of mitochondrial proteomes, cellular transcriptomes and targeted metabolomics of five knockout mouse strains deficient in essential factors required for mitochondrial DNA gene expression, leading to OXPHOS dysfunction. Moreover, we describe sequential protein changes during post-natal development and progressive OXPHOS dysfunction in time course analyses in control mice and a middle lifespan knockout, respectively. Very unexpectedly, we identify a new response pathway to OXPHOS dysfunction in which the intra-mitochondrial synthesis of coenzyme Q (ubiquinone, Q) and Q levels are profoundly decreased, pointing towards novel possibilities for therapy. Our extensive omics analyses provide a high-quality resource of altered gene expression patterns under severe OXPHOS deficiency comparing several mouse models, that will deepen our understanding, open avenues for research and provide an important reference for diagnosis and treatment.

Keywords: Cellular transcriptome; Coenzyme Q biosynthesis; Mitochondrial gene expression; Mitoproteome; OXPHOS dysfunction; One-carbon pathway; biochemistry; cell biology; mouse.


Conflict of interest statement

No competing interests declared.

Figures

Figure 1.
Figure 1.. Label-free quantification and comparison of mitoproteomes of mouse hearts with mitochondrial dysfunction.
(A) Schematic representation of the tissue-specific knockout strains (L/L, cre) used, with impaired mtDNA gene expression leading to mitochondrial dysfunction and corresponding controls (L/L). Nuclear-encoded mitochondrial proteins are illustrated in yellow and mtDNA-encoded mitochondrial proteins in blue. (B) Experimental workflow of the analysis of the transcriptomes and mitoproteomes from mouse heart generating three distinct datasets (1-3). Files are provided in Supplementary file 1–5, 8 and 9.
Figure 1—figure supplement 1.
Figure 1—figure supplement 1.. Activity of citrate synthase in heart from different L/L, cre and L/L mice.
Error bars ± SEM; *p<0.05, ***p<0.001; two-tailed unpaired Student’s t-test.
Figure 1—figure supplement 2.
Figure 1—figure supplement 2.. High reproducibility of the transcriptomic and mitoproteomic data.
(A) Reproducibility of the RNA-Seq (left) and label-free mass spectrometry (right) data is illustrated in heatmaps representing the Pearson’s correlation coefficient of all samples of the five different conditional knockouts (L/L, cre) and their corresponding controls (L/L) with the same scale; as an example of reproducibility a scatter plot of the label-free protein intensity values in two Polrmt L/L, cre samples and their correlation coefficient is shown. The number of biological replicates is indicated in parenthesis. (B) Number of identified (851 to 1348 proteins), quantified (673 to 1039 proteins) and mitochondrial proteins (586 to 704 proteins) across all L/L, cre hearts compared to corresponding L/L; error bars: ±SEM.
Figure 1—figure supplement 3.
Figure 1—figure supplement 3.. Analysis of systematic bias in the detection of mitochondrial proteins.
Cumulative distribution plots for mitochondrial proteins based on (A) GRAVY score as a measurement of hydrophobicity removing either only the first methionine of the amino acid sequence (left) of the first methionine and the mitochondrial targeting peptide (right). (B) Isoelectric point as a measure of charge hydrophobicity removing either only the first methionine of the amino acid sequence (left) of the first methionine and the mitochondrial targeting peptide (right). (C) mean RNA counts of L/L samples across all mouse strains as a measure of protein abundance. Met, methionine; mTP, mitochondrial targeting peptide; black, detected in at least one knockout mouse strain; red, not detected.
Figure 1—figure supplement 4.
Figure 1—figure supplement 4.. Distribution of label-free quantification (LFQ) intensities and fold changes of quantified proteins.
(A) Distribution of LFQ intensities of quantified proteins on L/L, cre and L/L mitoproteomes per knockout mouse strain. (B) Distribution of fold changes in L/L, cre and L/L mitoproteomes per knockout mouse strain. (C) MA-plots showing the distribution of fold changes in the mitoproteome mice compared to the average LFQ intensity of the proteins in L/L (top), L/L, cre (middle), or both genotypes (bottom) per knockout mouse strain. Black, p<0.05; gray p>0.05.
Figure 2.
Figure 2.. Mitochondrial transcriptome and proteome during post-natal development of mouse heart.
(A–B) Venn diagram of significantly changed (A) mitochondrial proteins and (B) genes encoding for transcripts of mitochondrial proteins of L/L mice (3–20 weeks). (C) Hierarchical clustering analysis of mitoproteomes of L/L mice (3–20 weeks). Left to right: pie chart illustrating percentages of significantly changed mitochondrial proteins in each cluster (1-4), in white: not classified (8%); protein changes over ages for each cluster, fold change relative to 3 week old mice were scaled and presented as Z-score; top three enriched categories of each cluster. Dotted line: Benjamini-Hochberg adjusted p=0.05. Parentheses indicate the number of proteins changed in that category per total number of proteins classified in that category. m.a. = mature adulthood. (D) Mitochondrial transcriptomic and proteomic 2D enrichment analysis showing enriched functional categories of L/L mice at different ages compared to weeks 3–4 based on the fold change. (E) Correlation plots of the L/L, cre versus L/L fold changes between mitoribosomal transcripts and proteins in L/L mice at different ages. Black line indicates the trend.
Figure 2—figure supplement 1.
Figure 2—figure supplement 1.. Rapid post-natal increase of mtDNA levels and factors required to maintain and express mtDNA in young wild-type mouse heart.
(A) mtDNA levels in total DNA from wild-type (+/+) mouse heart at different ages. 18S rDNA was used to normalize nuclear input. (B) Immunoblot quantification of some mitochondrial protein levels in heart extracts from wild-type mice at different ages. α-Tubulin was used for normalization. (C) Clustering analysis of significantly changing mitochondrial proteins in control mice (L/L) at different ages. m.a. = mature adulthood.
Figure 3.
Figure 3.. Enrichment of signalling and metabolic pathways in mouse hearts with severe mitochondrial dysfunction.
(A) Canonical pathway analysis of significantly changed genes in all knockouts with representation of the 12 most significant pathways. Grayscale heatmap: p value of each pathway based on Fisher’s exact test. Rectangles in horizontal heatmaps: average expression level in the five knockouts of each gene detected per pathway; Parenthesis: fraction of genes detected per pathway. (B) Transcript levels of genes encoding transcription factors involved in mitochondrial biogenesis in L/L, cre and L/L hearts. Normalization: B2M (beta-2-microglobulin). Twnk, Tfam, Polrmt, Lrpprc, and Mterf4 were used as controls for the corresponding knockout strains. (C–D) Expression levels of differentially expressed MYC and ATF4 target genes encoding mitochondrial proteins. Graphs average expression level in the five knockouts of each gene ± SD.
Figure 3—figure supplement 1.
Figure 3—figure supplement 1.. Several targets of MYC and ATF4 transcription factors are differentially regulated upon mitochondrial dysfunction.
Heatmaps illustrate the fold-change transcript levels in L/L, cre and L/L mouse hearts in an alphabetical order. Adjusted p<0.05 in all knockout mouse strains. (A) MYC target genes. (B) ATF4 target genes.
Figure 4.
Figure 4.. Remodeling of the mitochondrial transcriptome and proteome upon severe mitochondrial dysfunction.
Files are provided in Supplementary files 1 and 4. (A) Number of significantly changed transcripts (left) and mitochondrial proteins (right) quantified from L/L, cre compared to L/L; red: increased, blue: decreased. (B) Venn diagram of number of mitochondrial transcripts and proteins quantified and significant in ≥1 knockout strain. (C) Correlations of the L/L, cre versus L/L fold changes of significantly regulated mitochondrial transcripts and proteins. (D) Mitochondrial transcriptomic and proteomic 2D enrichment analysis showing the trend and degree of regulation of 15 functional categories in all different knockouts. (E) Scatterplots plots of the L/L, cre versus L/L fold changes of mitochondrial transcripts and proteins in different knockouts in a selection of categories. Black line indicates the trend. Same color code applied as in Figure 4D except for the OXPHOS category where the mitochondrial-encoded genes are colored in blue and the nuclear-encoded genes are colored in yellow.
Figure 4—figure supplement 1.
Figure 4—figure supplement 1.. Most of the identified transcripts of nuclear genes encoding mitochondrial proteins are decreased, whereas most of the quantified mitochondrial proteins were increased in abundance.
(A) Volcano plots of transcripts of genes encoding mitochondrial proteins for each knockout mouse strain. (B) Volcano plots of mitoproteomes for each knockout mouse strain. Black: p<0.05, grey: p>0.05. Top 1% of significantly changed mitochondrial transcripts and top 5% of significantly changed mitochondrial proteins are shown and listed in the dotted line boxes; red: increased, blue: decreased; p values were adjusted using Benjamini-Hochberg method. (C) Scatterplots showing the correlation between the mitochondrial transcriptomics and proteomics data for each knockout mouse strain (L/L, cre compared to L/L). Each point corresponds to one quantified gene. Correlation coefficient and p values were calculated with Pearson correlation test.
Figure 4—figure supplement 2.
Figure 4—figure supplement 2.. Correlations of the L/L, cre versus L/L fold changes of significantly regulated mitochondrial transcripts and proteins.
Figure 4—figure supplement 3.
Figure 4—figure supplement 3.. Distribution of MYC and ATF4 target genes in scatterplots plots of the L/L, cre versus L/L fold changes of mitochondrial transcripts and proteins in different knockouts in a selection of categories.
Figure 5.
Figure 5.. Effects of impaired mtDNA gene expression on mitochondrial protein levels in heart.
Heatmaps illustrating the fold-change transcript (left) and mitochondrial protein (right) levels in L/L, cre and L/L mouse hearts in alphabetical order; blank boxes: not detected or not quantified. Adjusted p<0.05 in≥1 knockout strain. (A) OXPHOS complexes (complex II is only nuclear encoded). (B) OXPHOS assembly. (C) Mitochondrial ribosomal proteins; n/a = not applicable. (D) Degradation and stress response. (E) Apoptosis. For a selection of mitochondrial proteins the steady state levels were verified by immunoblotting shown in Figure 5—figure supplement 2.
Figure 5—figure supplement 1.
Figure 5—figure supplement 1.. Proteins regulating mitochondrial morphology, iron sulphur cluster and heme biogenesis are increased.
Heatmaps illustrating the fold-change transcript (left) and mitochondrial protein (right) levels in L/L, cre and L/L mouse hearts in alphabetical order; blank boxes in heatmap: not identified or not quantified. Adjusted p<0.05 in at least one of the knockout mouse strains for the genes encoding mitochondrial transcript or protein levels. (A) Mitochondrial morphology. (B) Mitochondrial import and chaperones. (C) Iron sulphur cluster and heme biogenesis. (D) Mitochondrial DNA replication and maintenance. (E) Mitochondrial transcription and mt-RNA metabolism. (F) Other mitochondrial protein synthesis factors.
Figure 5—figure supplement 2.
Figure 5—figure supplement 2.. Immunoblot of several mitochondrial proteins in extracts from L/L, cre and L/L hearts; Loading of 6 different membranes: SDHA, SDHB or VDAC1.
Figure 6.
Figure 6.. Up-regulation of the enzymes of the mitochondrial 1C pathway happens before deficient OXPHOS is detectable in mouse heart.
(A) Scheme of 1C pathway. Colored boxes: protein levels; red: increased, grey: not detected or not quantified. (B) Heatmaps showing the fold-change in transcript (left) and protein (right) levels in alphabetical order of L/L, cre and L/L mouse hearts of the 1C pathway; p<0.0001 in≥1 knockout strain. (C) Immunoblot of enzymes of the 1C pathway in total protein extracts from L/L, cre and L/L; Loading: tubulin. (D) Quantification of 1C donor metabolite levels in L/L, cre and L/L. Graphs represent mean ± SEM (*p<0.05, **p<0.01, ***p<0.001). (E) Time point analysis of protein levels of enzymes of the 1C pathway (top), and LRPPRC and VDAC (bottom) in Lrpprc knockout hearts compared to controls. Yellow line: average value of nuclear and mitochondrial encoded OXPHOS complex IV subunits. Adjusted p<0.05, except for VDAC. LRPPRC and VDAC protein levels at the different time points were verified by immunoblotting presented in Figure 6—figure supplement 1.
Figure 6—figure supplement 1.
Figure 6—figure supplement 1.. Steady-state LRPPRC protein levels at different time points in mitochondrial extracts from Lrpprc L/L, cre and L/L hearts; Loading: VDAC1.
Figure 7.
Figure 7.. Up-regulated glutamate to proline conversion in mitochondrial OXPHOS deficient heart.
(A) Scheme of the glutamate to proline conversion pathway. Colored boxes: protein levels; red: increased, blue: decreased. (B) Heatmaps illustrating the fold-change transcript (left) and protein (right) levels. Adjusted p<0.05 in≥1 knockout strain for genes encoding mitochondrial transcript or protein levels. (C) Time point analysis of protein levels of enzymes of the glutamate to proline conversion pathway in Lrpprc knockout hearts compared to controls. Yellow line: average value of nuclear and mitochondrial encoded OXPHOS complex IV subunits. Adjusted p<0.05. (D) Quantification of proline and glutamate in different L/L, cre and L/L mouse hearts. Error bars:± SEM; **p<0.01; two-tailed unpaired Student’s t-test.
Figure 8.
Figure 8.. OXPHOS dysfunction leads to decreased cellular Q levels, but the enzymes of the mevalonate pathway are normal.
(A) Scheme of the mevalonate and Q biosynthesis pathways, and OXPHOS complexes (Nuclear-encoded OXPHOS proteins are shown in yellow and mtDNA-encoded OXPHOS proteins in blue). Colored boxes: protein levels; red: increased, blue: decreased, grey: not detected or not quantified. (B) Heatmaps illustrating the fold-change protein levels of the Q biosynthesis pathway in alphabetical order of L/L, cre and L/L mouse hearts; blank boxes: not detected or not quantified proteins; p<0.05 in≥1 knockout strain. (C) Immunoblot of enzymes of the mevalonate pathway on total protein extracts from different L/L, cre and L/L hearts. Loading: tubulin. (D) Transcript levels of genes encoding enzymes of the mevalonate and coenzyme Q synthesis pathway in L/L, cre and L/L hearts. Normalization: B2M (beta-2-microglobulin). (E) Protein levels of OXPHOS complexes I-V and the downregulated Q biosynthesis enzymes at different time points in Lrpprc knockout mouse hearts compared to controls. The graph represents a mean log2 fold-change of all the proteins in that category. (F) Time point analysis of protein levels of enzymes of the Q biosynthesis pathway in Lrpprc knockout mouse hearts compared to controls. Adjusted p across time <0.05. (G) Quinone quantification (Q9 and Q10) in different L/L, cre and L/L mouse hearts. Error bars:± SEM; *p<0.05, **p<0.01, ***p<0.001; two-tailed unpaired Student’s t-test.
Figure 8—figure supplement 1.
Figure 8—figure supplement 1.. Transcript levels of genes encoding for enzymes of the mevalonate and the Q synthesis pathways.
(A) Heatmaps showing the fold-change transcript levels in alphabetical order of L/L, cre and L/L mouse hearts of the mevalonate and the Q biosynthesis pathways by RNA-Seq.; blank boxes: not detected or not quantified transcript; adjusted p<0.05 in≥1 knockout mouse line. (B) qRT-PCR of transcript levels of genes encoding enzymes of coenzyme Q synthesis pathway in different L/L, cre and L/L hearts, normalized to B2M (beta-2-microglobulin). All graphs represent mean ± SEM; *p<0.05, **p<0.01, ***p<0.001.

Similar articles

Cited by

References

    1. Ahuja P, Zhao P, Angelis E, Ruan H, Korge P, Olson A, Wang Y, Jin ES, Jeffrey FM, Portman M, Maclellan WR. Myc controls transcriptional regulation of cardiac metabolism and mitochondrial biogenesis in response to pathological stress in mice. Journal of Clinical Investigation. 2010;120:1494–1505. doi: 10.1172/JCI38331. - DOI - PMC - PubMed
    1. Arroyo JD, Jourdain AA, Calvo SE, Ballarano CA, Doench JG, Root DE, Mootha VK. A Genome-wide CRISPR death screen identifies genes essential for oxidative phosphorylation. Cell Metabolism. 2016;24:875–885. doi: 10.1016/j.cmet.2016.08.017. - DOI - PMC - PubMed
    1. Bao XR, Ong SE, Goldberger O, Peng J, Sharma R, Thompson DA, Vafai SB, Cox AG, Marutani E, Ichinose F, Goessling W, Regev A, Carr SA, Clish CB, Mootha VK. Mitochondrial dysfunction remodels one-carbon metabolism in human cells. eLife. 2016;5:e10575. doi: 10.7554/eLife.10575. - DOI - PMC - PubMed
    1. Bender HU, Almashanu S, Steel G, Hu CA, Lin WW, Willis A, Pulver A, Valle D. Functional consequences of PRODH missense mutations. The American Journal of Human Genetics. 2005;76:409–420. doi: 10.1086/428142. - DOI - PMC - PubMed
    1. Calvo SE, Clauser KR, Mootha VK. MitoCarta2.0: an updated inventory of mammalian mitochondrial proteins. Nucleic Acids Research. 2016;44:D1251–D1257. doi: 10.1093/nar/gkv1003. - DOI - PMC - PubMed

Publication types

Supplementary concepts