. 2018 Mar;45(2):114-122.
doi: 10.1016/j.neurad.2017.10.001. Epub 2017 Nov 11.

Bullseye's representation of cerebral white matter hyperintensities

Affiliations

Bullseye's representation of cerebral white matter hyperintensities

C H Sudre et al. J Neuroradiol. 2018 Mar.

Abstract

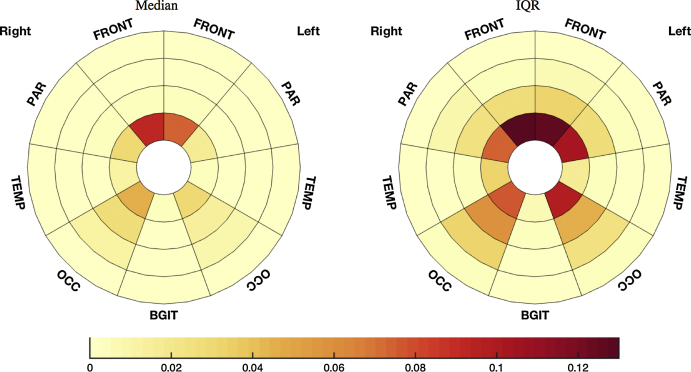
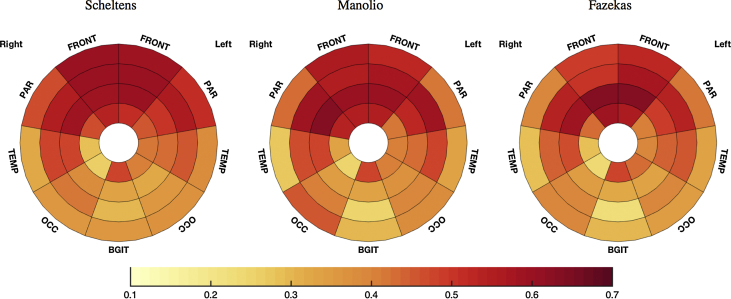
Background and purpose: Visual rating scales have limited capacities to depict the regional distribution of cerebral white matter hyperintensities (WMH). We present a regional-zonal volumetric analysis alongside a visualization tool to compare and deconstruct visual rating scales.

Materials and methods: 3D T1-weighted, T2-weighted spin-echo and FLAIR images were acquired on a 3T system, from 82 elderly participants in a population-based study. Images were automatically segmented for WMH. Lobar boundaries and distance to ventricular surface were used to define white matter regions. Regional-zonal WMH loads were displayed using bullseye plots. Four raters assessed all images applying three scales. Correlations between visual scales and regional WMH as well as inter and intra-rater variability were assessed. A multinomial ordinal regression model was used to predict scores based on regional volumes and global WMH burdens.

Results: On average, the bullseye plot depicted a right-left symmetry in the distribution and concentration of damage in the periventricular zone, especially in frontal regions. WMH loads correlated well with the average visual rating scores (e.g. Kendall's tau [Volume, Scheltens]=0.59 CI=[0.53 0.62]). Local correlations allowed comparison of loading patterns between scales and between raters. Regional measurements had more predictive power than global WMH burden (e.g. frontal caps prediction with local features: ICC=0.67 CI=[0.53 0.77], global volume=0.50 CI=[0.32 0.65], intra-rater=0.44 CI=[0.23 0.60]).

Conclusion: Regional-zonal representation of WMH burden highlights similarities and differences between visual rating scales and raters. The bullseye infographic tool provides a simple visual representation of regional lesion load that can be used for rater calibration and training.

Keywords: Ageing; Location; Magnetic resonance imaging; Visual rating scales; White matter hyper intensities.


Figures

Fig. 1
Fig. 1
Representation of the building blocks of the local WMH lesion loads. The first column reflects the lesion segmentation. The second column refers to the separation according to the lobar regions and the last column to the distance based layer separation from the ventricular surface towards the cortical sheet. The lesion frequency per defined local region is then summarized in the bullseye plot. Most central parts correspond to the most periventricular regions. The lobar regions are represented according to the angular position and referred to by their first letters. The subject is male, 75 years old.
Fig. 2
Fig. 2
Median (left) and IQR (right) of the WMH burden frequency per zone represented in bullseye plot.
Fig. 3
Fig. 3
Kendall's tau correlation between the regional WMH lesion loads and each Scheltens subscale. See plot titles for the corresponding evaluated region. On the bottom row from left to right: frontal lobe, parietal lobe, occipital lobe and temporal lobe. Note the higher correlations between the periventricular subscales and central WMH loads in the bullseyes and at the periphery of the plot for lobar scores. The bigger plot on the left represents the correlations between the global score and the local lesion frequencies, showing that the frontal lobe had the highest overall loading.
Fig. 4
Fig. 4
Plots of the rating discrepancies between one rater and the average of the others calculated as the difference between the Kendall's tau correlations of the local measures of WMH burden with one rater and with the average score given by the three remaining raters. Each column corresponds to a visual scale. Each row corresponds to a different individual rater.
Fig. 5
Fig. 5
Plots of the correlations between local burden measures and the average of the four raters for each of the visual scales.
Fig. 6
Fig. 6
Screen-shot of the training system at the outset of the process to rate the periventricular subscales in the Scheltens scale. An explanation of the subscales description is always made available to the trainee.

References

    1. Wardlaw J.M., Smith E.E., Biessels G.J. Neuroimaging standards for research into small vessel disease and its contribution to ageing and neurodegeneration. Lancet Neurol. 2013;12:822–838. - PMC - PubMed
    1. Schmidt R., Schmidt H., Haybaeck J. Heterogeneity in age-related white matter changes. Acta Neuropathol. 2011;122:171–185. - PubMed
    1. Inzitari D., Pracucci G., Poggesi A. Changes in white matter as determinant of global functional decline in older independent outpatients: three year follow-up of LADIS (leukoaraiosis and disability) study cohort. BMJ. 2009;339(jul06_1):b2477. - PMC - PubMed
    1. Flanagan M., Larson E.B., Latimer C.S. Clinical-pathologic correlations in vascular cognitive impairment and dementia. Biochim Biophys Acta. 2015;1864:945–951. - PMC - PubMed
    1. Kuller L.H., Margolis K.L., Gaussoin S.A. Relationship of hypertension, blood pressure, and blood pressure control with white matter abnormalities in the Women's Health Initiative Memory Study (WHIMS)-MRI trial. J Clin Hypertens. 2010;12(3):203–212. - PMC - PubMed