. 2017 Dec;27(12):1974-1987.
doi: 10.1101/gr.223727.117. Epub 2017 Nov 13.

Convergent origination of a Drosophila-like dosage compensation mechanism in a reptile lineage

Affiliations

Convergent origination of a Drosophila-like dosage compensation mechanism in a reptile lineage

Ray Marin et al. Genome Res. 2017 Dec.

Abstract

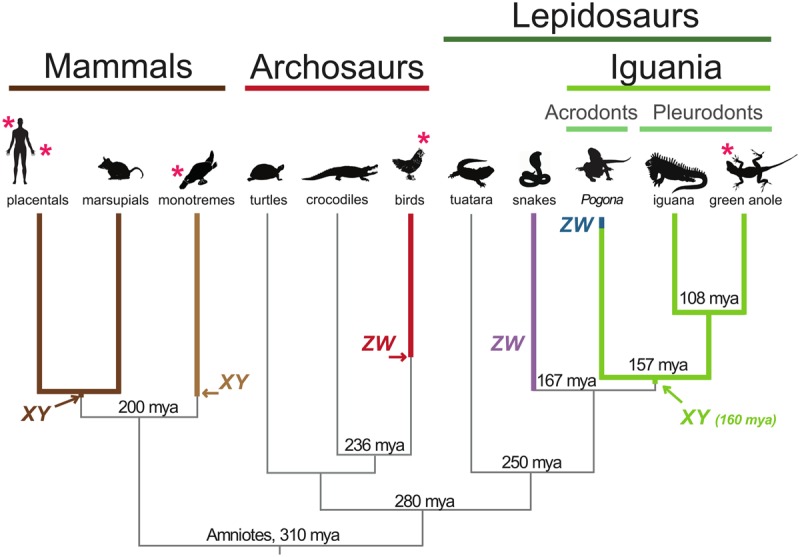
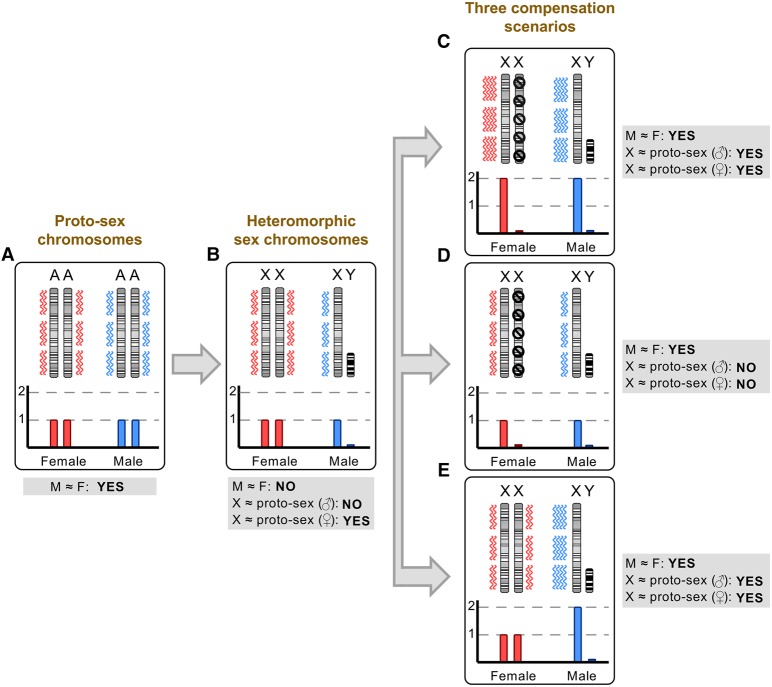
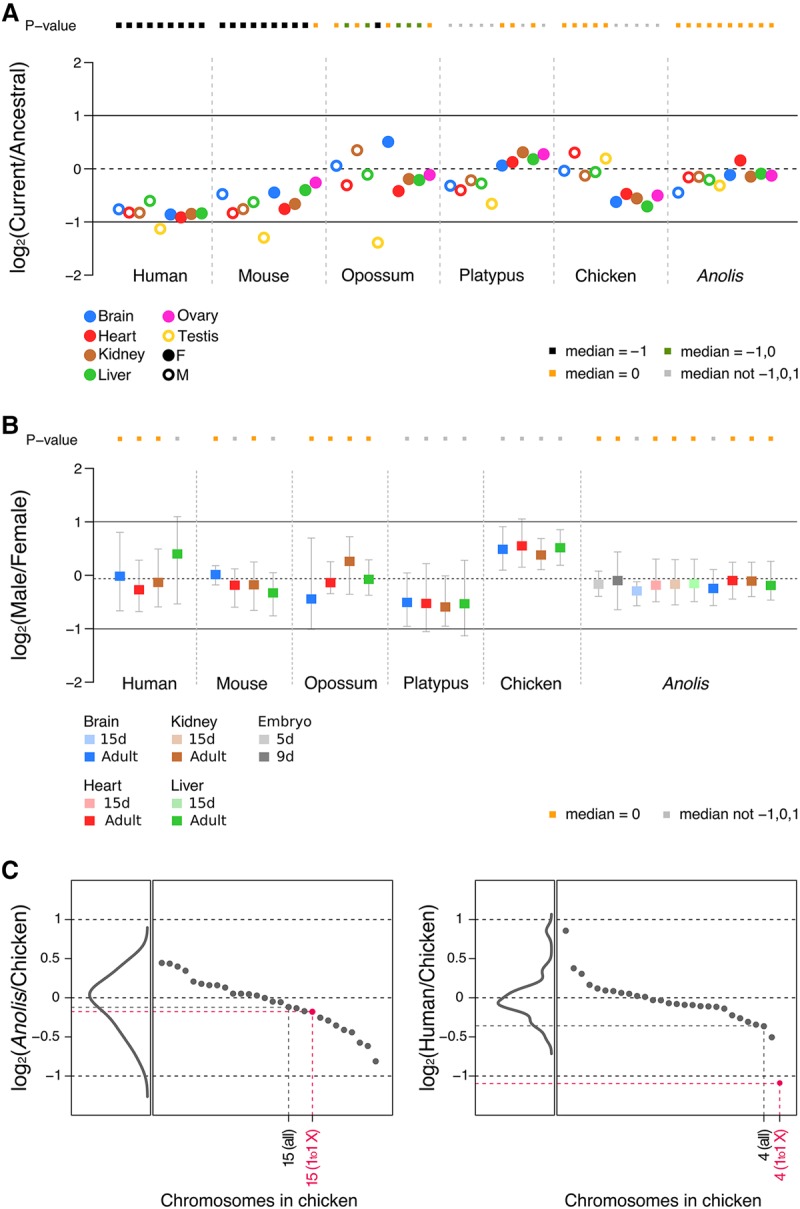
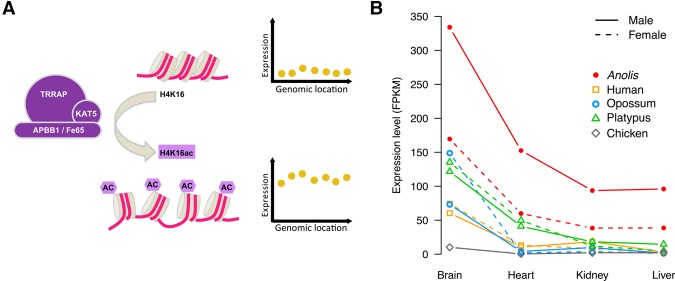
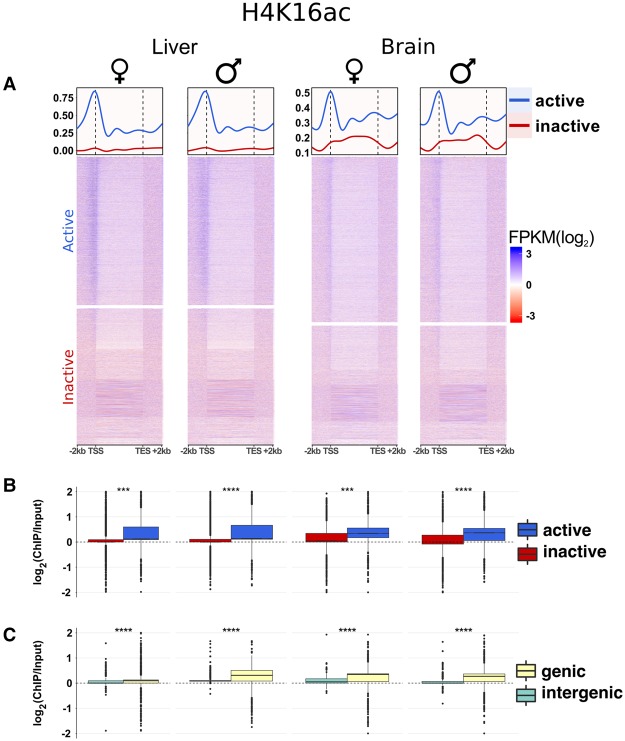
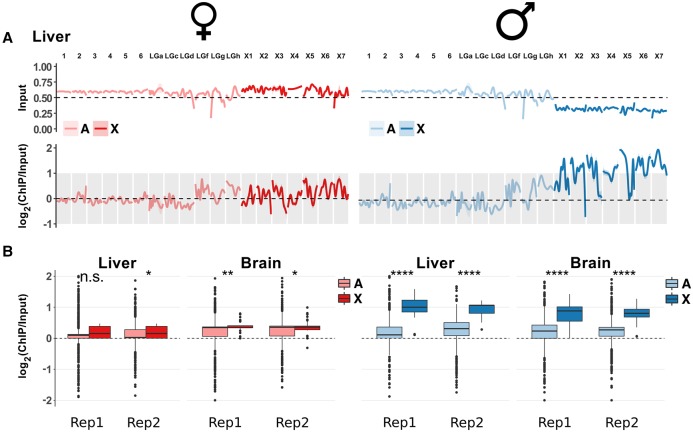
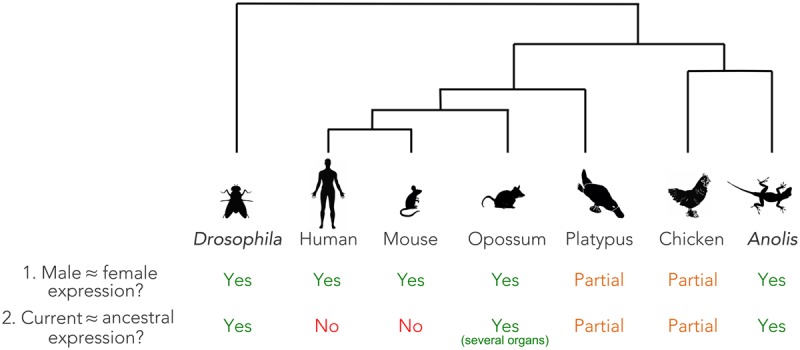
Sex chromosomes differentiated from different ancestral autosomes in various vertebrate lineages. Here, we trace the functional evolution of the XY Chromosomes of the green anole lizard (Anolis carolinensis), on the basis of extensive high-throughput genome, transcriptome and histone modification sequencing data and revisit dosage compensation evolution in representative mammals and birds with substantial new expression data. Our analyses show that Anolis sex chromosomes represent an ancient XY system that originated at least ≈160 million years ago in the ancestor of Iguania lizards, shortly after the separation from the snake lineage. The age of this system approximately coincides with the ages of the avian and two mammalian sex chromosomes systems. To compensate for the almost complete Y Chromosome degeneration, X-linked genes have become twofold up-regulated, restoring ancestral expression levels. The highly efficient dosage compensation mechanism of Anolis represents the only vertebrate case identified so far to fully support Ohno's original dosage compensation hypothesis. Further analyses reveal that X up-regulation occurs only in males and is mediated by a male-specific chromatin machinery that leads to global hyperacetylation of histone H4 at lysine 16 specifically on the X Chromosome. The green anole dosage compensation mechanism is highly reminiscent of that of the fruit fly, Drosophila melanogaster Altogether, our work unveils the convergent emergence of a Drosophila-like dosage compensation mechanism in an ancient reptilian sex chromosome system and highlights that the evolutionary pressures imposed by sex chromosome dosage reductions in different amniotes were resolved in fundamentally different ways.


Figures

Figure 1.
Figure 1.
Major amniote lineages and sex chromosome origins. The silhouettes indicate representative species for each group. Ages of main speciation events obtained from TimeTree (www.timetree.org) are indicated (millions of years ago, mya). Arrows indicate previously estimated ages of sex systems origins in amniotes (Cortez et al. 2014) and the age of the Anolis XY system as estimated in this study (see main text and Supplemental Fig. S1). Note that the age of the emergence of the snake ZW system and Pogona ZW system are not precisely known (see main text). Lineages for which RNA-seq data were generated in this study are marked by an asterisk.
Figure 2.
Figure 2.
Scenarios for dosage compensation after sex chromosome differentiation. (A) Sex chromosomes stem from ordinary pairs of ancestral autosomes, also known as proto-sex chromosomes. (B) Following sex chromosome differentiation and extensive Y gene loss, females retain two active X Chromosomes while males are left with a single active X and a Y Chromosome with only very few remaining ancestral genes (i.e., males effectively retain only one of the ancestral copies for most genes). Several scenarios for how this dosage reduction was compensated have been proposed and/or described; three prominent scenarios are outlined in panels CE. (C) A twofold up-regulation of all X-linked genes in both sexes is secondarily compensated by the inactivation (black symbols) of one X Chromosome in females (Ohno's hypothesis) (Ohno 1967). This scenario applies to at least several tissues of marsupials (imprinted XCI is present in marsupials) (Fig. 3A; Grant et al. 2012). (D) The expression output of the X Chromosome remains unchanged in both sexes, and one of the female X Chromosomes is secondarily inactivated. This scenario is observed—at least globally and at the transcriptional level—in placentals (Fig. 3A; Julien et al. 2012; Lin et al. 2012; Mank 2013). Note that it is not clear in this scenario how a dosage reduction without expression increase could be tolerated and why random X inactivation evolved in these mammals; i.e., this scenario is shown because it illustrates the currently known placental pattern. Alternative mechanisms (e.g., down-regulation of autosomal partner genes, translational up-regulation) likely contributed to dosage compensation of haploinsufficient genes in this scenario (see main text). (E) Females retained two active X Chromosomes and a male-specific epigenetic mechanism prompted a twofold up-regulation of the X Chromosome in males. This scenario is observed in both Drosophila (Conrad and Akhtar 2012) and Anolis (this study; Conrad and Akhtar 2012).
Figure 3.
Figure 3.
Expression level evolution of X-linked genes across amniotes. (A) Ratios of current expression levels of X-linked genes (median value) and their ancestral expression levels (median value) in four somatic tissues and gonads. Multiple outgroup species were used to calculate the ancestral expression levels (for therians: chicken, platypus, Anolis, Xenopus; for chicken/platypus: mouse, opossum, Anolis, Xenopus; for Anolis: mouse, opossum, chicken, platypus, Xenopus; note: human was not used as an outgroup anywhere, given that no ovary data were available). Full circles represent female tissues, whereas empty circles represent male tissues. Significant differences (Mann-Whitney U test): Benjamini-Hochberg-corrected P < 0.05 of current to ancestral ratios compared to reference values 1, 0, and −1. Orange squares indicate a current to ancestral ratio not significantly different from 0 (i.e., expression levels of X-linked genes have been preserved during evolution). Black squares indicate a current to ancestral ratio not significantly different from −1 but different from other reference values (i.e., expression levels decreased twofold during evolution). Green squares denote a current to ancestral ratio not different from −1 and 0, and gray squares indicate ratios different from −1, 0, and 1. For chicken, Z-linked genes were analyzed. We observe very similar patterns when using chicken or Xenopus as an outgroup (Supplemental Fig. S9). (B) Male to female expression level ratios in four somatic tissues and gonads across amniotes. Error bars indicate maximum and minimum values, excluding outliers. Tests of significance are analogous to those indicated for panel A. All underlying expression values are calculated as FPKM. (C) Median values (across the four somatic organs: brain, heart, liver, kidney) calculated from ratios of current expression levels of Anolis or human genes compared to current expression levels of 1:1 orthologous genes in chicken (the outgroup). Individual gene ratios were grouped following the chromosomal annotation in chicken and the median values for each chromosome are indicated and sorted in descending order (black and pink dots). Density diagrams represent the distribution of median values. In pink: median values for all genes in Chromosomes 4 and 15 of chicken (marked as “all”) and those with only 1:1 orthologous genes in the Anolis and human X Chromosomes (marked as “1to1 X”). Note that genes in chicken Chromosome 4 are only partially corresponding to human X-linked genes, while genes in the Anolis X almost entirely correspond to orthologs in chicken Chromosome 15. See Supplemental Figure S8 for the complete list of used autosomes.
Figure 4.
Figure 4.
Potential factors of Anolis H4K16 acetylation machinery and APBB1 expression profile in Anolis males and females. (A) Schematic model depicting the up-regulation of gene expression following the histone H4K16 acetylation, catalyzed by the TRRAP-KAT5-APBB1 protein complex. (B) Expression profile of the APBB1 gene in male and female somatic tissues in Anolis and other amniotes.
Figure 5.
Figure 5.
Features of H4K16ac in Anolis and its relationship with gene expression and genic regions. (A) Heat maps and average profiles showing input-normalized H4K16ac ChIP-seq (FPKM) signals for all Anolis genes sorted by gene expression values (FPKM) in decreasing order (top to bottom). The signal is particularly enriched along the gene body with peaks around TSS for active genes. The data illustrate the clear distinction between active and inactive genes (median curves) and the correlation between H4K16ac activity and gene expression, where ChIP-seq FPKM values tend to decrease with decreasing RNA-seq FPKM values (heat maps). The y-axis scale is the same for both sexes within each tissue. (B) Comparisons of H4K16ac signal distributions between active and inactive genes. (C) H4K16ac signal comparisons between genic and intergenic regions; genic regions include intervals between the TSS and transcription end site plus 2-kb regions upstream of the TSS. Supplemental Figure S11 contains similar plots for all samples. Active genes: FPKM ≥ 1, inactive genes: FPKM < 1. Statistical (Mann-Whitney U) test significance levels: (n.s.) not significant; (*) P ≤ 0.05; (**) P ≤ 0.01; (***) P ≤ 0.001; (****) P ≤ 10−10.
Figure 6.
Figure 6.
H4K16ac enrichment on the X Chromosome of Anolis males. (A) Genome-wide ChIP-seq profile along autosomes (light colors) and X-linked contigs (dark colors) for Anolis liver. Upper plots show data for the input (i.e., DNA prior to immunoprecipitation), which illustrate that the male X has only approximately half the coverage compared to autosomes and female X, consistent with the hemizygous state of male Anolis sex chromosomes. Lower plots display the input-normalized ChIP-seq signals and show the H4K16ac enrichment on the male X. All chromosomes are scaled to the same length; pink and light blue shaded areas around profile lines correspond to 95% confidence intervals. See Supplemental Figure S13 for the full data set (both organs, all replicates). Contig names correspond to those defined in the original Anolis genome paper (Alfoldi et al. 2011). (LG) Linkage group, (X1) LGb, (X2) GL343282.1, (X3) GL343338.1, (X4) GL343364.1, (X5) GL343417.1, (X6) GL343423.1, (X7) GL343550.1. (B) Comparison of H4K16ac distributions between autosomes and X Chromosomes along genic regions. Significance symbols are defined as in Figure 5. (Rep1) biological replicate 1; (Rep2) biological replicate 2. Comparisons along the whole genome and specifically for intergenic regions are reported in Supplemental Figure S12, A and B.
Figure 7.
Figure 7.
Global patterns of dosage compensation in amniotes and Drosophila. Presence, absence, or partial presence of: (1) similar expression levels of X-linked genes in males and females; (2) maintenance of ancestral expression levels of X-linked genes following sex chromosome differentiation (Y/W decay).

References

    1. Akagi T, Henry IM, Tao R, Comai L. 2014. Plant genetics. A Y-chromosome-encoded small RNA acts as a sex determinant in persimmons. Science 346: 646–650. - PubMed
    1. Alfoldi J, Di Palma F, Grabherr M, Williams C, Kong L, Mauceli E, Russell P, Lowe CB, Glor RE, Jaffe JD, et al. 2011. The genome of the green anole lizard and a comparative analysis with birds and mammals. Nature 477: 587–591. - PMC - PubMed
    1. Altschul SF, Gish W, Miller W, Myers EW, Lipman DJ. 1990. Basic local alignment search tool. J Mol Biol 215: 403–410. - PubMed
    1. Bachtrog D. 2013. Y-chromosome evolution: emerging insights into processes of Y-chromosome degeneration. Nat Rev Genet 14: 113–124. - PMC - PubMed
    1. Bachtrog D, Mank JE, Peichel CL, Kirkpatrick M, Otto SP, Ashman TL, Hahn MW, Kitano J, Mayrose I, Ming R, et al. 2014. Sex determination: why so many ways of doing it? PLoS Biol 12: e1001899. - PMC - PubMed

Publication types