. 2018 Jan 22;86(2):e00635-17.
doi: 10.1128/IAI.00635-17. Print 2018 Feb.

Small RNA teg49 Is Derived from a sarA Transcript and Regulates Virulence Genes Independent of SarA in Staphylococcus aureus

Affiliations

Small RNA teg49 Is Derived from a sarA Transcript and Regulates Virulence Genes Independent of SarA in Staphylococcus aureus

Adhar C Manna et al. Infect Immun. .

Abstract

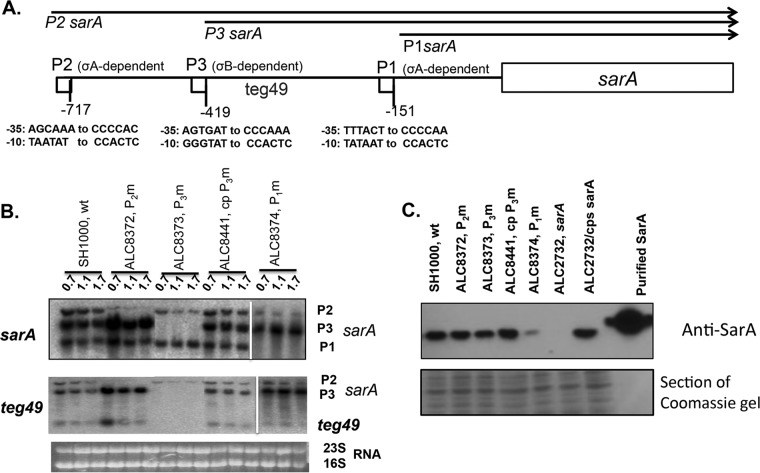
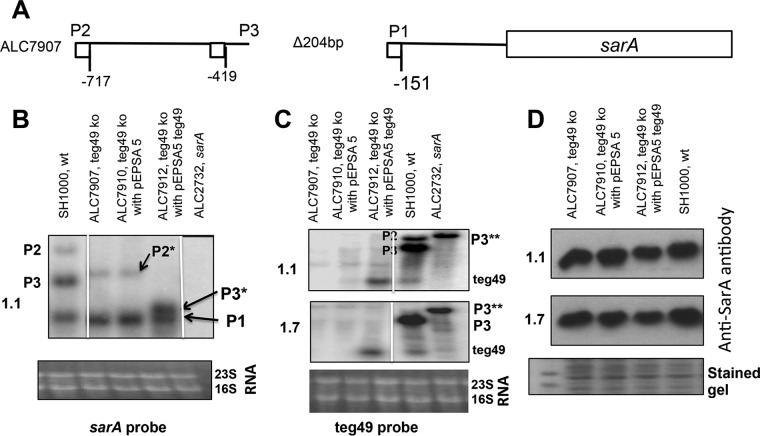
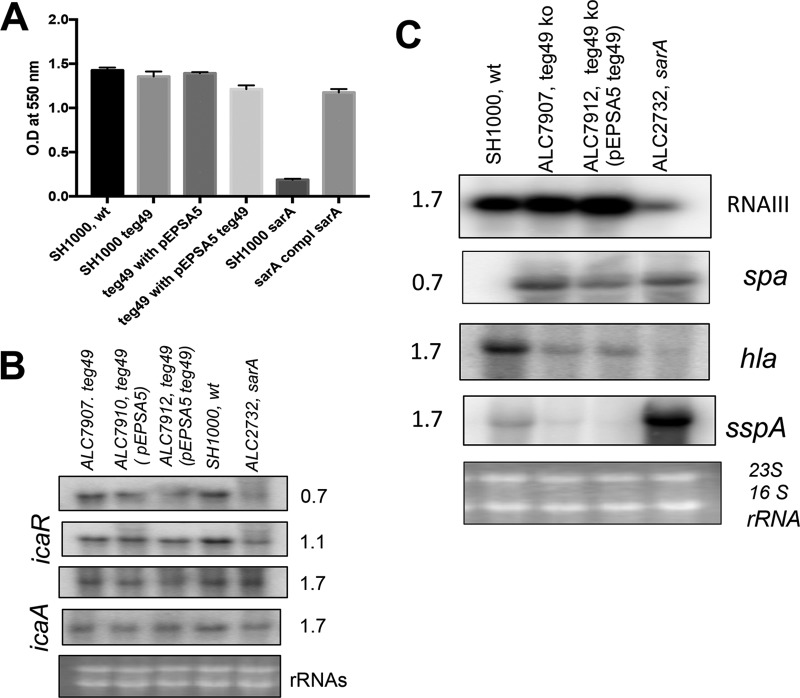
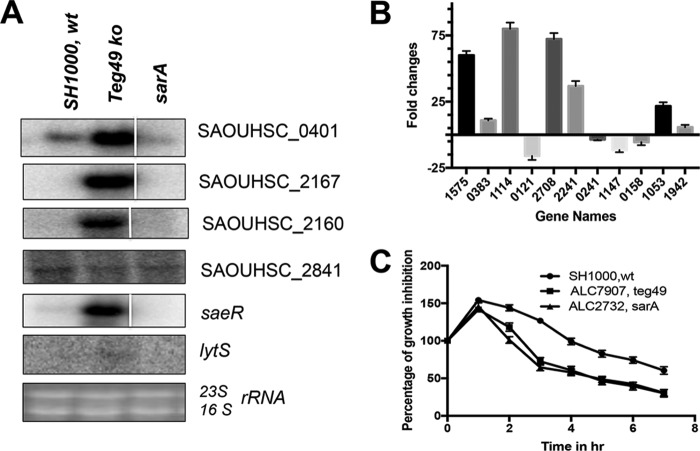
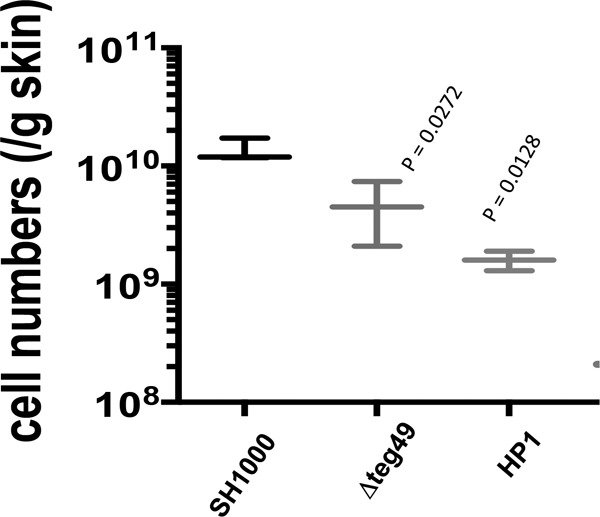
Expression of virulence factors in Staphylococcus aureus is regulated by a wide range of transcriptional regulators, including proteins and small RNAs (sRNAs), at the level of transcription and/or translation. The sarA locus consists of three overlapping transcripts generated from three distinct promoters, all containing the sarA open reading frame (ORF). The 5' untranslated regions (UTRs) of these transcripts contain three separate regions ∼711, 409, and 146 nucleotides (nt) upstream of the sarA translation start, the functions of which remain unknown. Recent transcriptome-sequencing (RNA-Seq) analysis and subsequent characterization indicated that two sRNAs, teg49 and teg48, are processed and likely produced from the sarA P3 and sarA P1 transcripts of the sarA locus, respectively. In this report, we utilized a variety of sarA promoter mutants and cshA and rnc mutants to ascertain the contributions of these factors to the generation of teg49. We also defined the transcriptional regulon of teg49, including virulence genes not regulated by SarA. Phenotypically, teg49 did not impact biofilm formation or affect overall SarA expression significantly. Comparative analyses of RNA-Seq data between the wild-type, teg49 mutant, and sarA mutant strains indicated that ∼133 genes are significantly upregulated while 97 are downregulated in a teg49 deletion mutant in a sarA-independent manner. An abscess model of skin infection indicated that the teg49 mutant exhibited a reduced bacterial load compared to the wild-type S. aureus Overall, these results suggest that teg49 sRNA has a regulatory role in target gene regulation independent of SarA. The exact mechanism of this regulation is yet to be dissected.

Keywords: RNA-Seq; S. aureus; SarA; biofilms; gene expression; gene regulation; mouse model; small RNAs.


Figures

FIG 1
FIG 1
Expression of the sarA transcripts and teg49 sRNA from sarA promoter mutants at various phases of growth in S. aureus. (A) Schematic representation of the sarA locus showing various transcripts (sarA P2, sarA P3, and sarA P1) that originate from the P2, P3, and P1 promoters (arrows), respectively. The sarA open reading frame is indicated by a box, and the promoters are indicated by small boxes. The numbers of the promoter locations are based on the start codon (ATG) of the sarA gene. (B) Northern blot analysis of total RNA isolated from the wild-type SH1000 and the various isogenic promoter mutants at various phases of growth recorded as OD600 values (OD600 values of 0.7, 1.1, and 1.5 represent mid-log, late log, and early stationary phases, respectively). In all the gels, 10 μg of total cellular RNA was loaded onto each lane, and the blots were probed with a 375-bp sarA DNA probe containing the sarA ORF (top) or a 180-bp DNA fragment containing teg49 (middle). The 16S and 23S rRNAs of the ethidium bromide-stained gel used for blotting is also shown as a loading control at the bottom. The spliced images were taken from different regions of the same image. (C) Western blot analysis for SarA, with anti-SarA antibody, of the wild type, its isogenic promoter mutants, the sarA mutant, and a complemented mutant. Equivalent amounts of extracts (10 μg) from the late exponential phase of growth (OD600 ≈ 1.1) were used to detect SarA protein. (Bottom) A Coomassie blue-stained duplicate-run gel used for blotting is shown as a loading control.
FIG 2
FIG 2
Northern blots of diverse mutants to determine the expression of teg49 and teg23 sRNAs. (A) Northern blot analysis for the teg49 sRNA in the wild-type JE2 and its isogenic RNase and other putative mutants as indicated. (B) Northern blot analyses to determine the expression of sRNAs (teg49, teg23, and teg35) in the wild-type, cshA, hfq, rnc, and complemented rnc strains hybridized with radiolabeled 180-bp teg49, 190-bp teg23, and 225-bp teg35 probes. A total of 10 μg of cellular RNA from the various phases of growth was loaded onto each lane. An ethidium bromide-stained gel used for blotting, showing 16S and 23S rRNA bands, is shown as the loading control. The spliced images are taken from different regions of the same image. The numbers above the gels are OD600 values.
FIG 3
FIG 3
Expression of sarA transcripts and teg49 sRNA in the teg49 mutant and its derivative strains at various phases of growth in S. aureus. (A) Schematic representation of the teg49 mutant showing the region deleted to construct the mutant (ALC7907). (B and C) Northern analysis of RNA isolated from the wild-type SH1000, teg49 mutant (7907), teg49 mutant with pEPSA5 (7910), and teg49 mutant with pEPSA5::teg49 and the sarA deletion mutant (ALC2732) at different growth phases. The blots were probed with a 375-bp DNA probe containing the open reading frame of the sarA gene (B) or a 180-bp DNA fragment containing teg49 (C). The 16S and 23S rRNA bands in an ethidium bromide-stained gel served as loading controls. Various sarA transcripts (P2, P3, and P1) are marked, while P2* and P3* (B) indicate the corresponding truncated transcripts due to deletion of the teg49 region. P3** (C) denotes the size of the P3 transcript in the sarA mutant of SH1000, where the sarA gene has been replaced by ermC. The spliced images were taken from different regions of the same image. (D) Western blot analyses for SarA with anti-SarA antibody of the wild type, the teg49 strain, and its isogenic derivative strains from panels B and C. Equivalent amounts of extracts (10 μg) from the different phases of growth (OD600 ≈ 1.1, late exponential phase; OD600 ≈ 1.7, postexponential phase) were used to detect SarA protein. (Bottom) A section of Coomassie blue-stained duplicate-run gel used for blotting is shown as a loading control for all the gels. All the strains containing pEPSA5 and its derivatives were grown in the presence of 2% xylose to induce teg49 expression. The numbers at the left of the gels are the OD600 values.
FIG 4
FIG 4
Phenotypic and genetic analyses for biofilm formation and selective virulence gene expression for the teg49 mutant and its derivative strains. (A) Biofilm formation by various strains in microtiter wells containing TSB and 0.25% glucose. The cells were grown for 24 h, and the biofilms were stained with crystal violet and solubilized with acetic acid to read OD550. The sarA mutant and complemented mutant were used as negative and positive controls, respectively. The results are expressed as means and standard errors of the mean. (B) Northern blots for the wild-type, teg49 mutant, teg49 containing pEPSA5, teg49 mutant containing pEPSA5::teg49, and isogenic sarA mutant strains at various phases of growth. The probes used for hybridization were icaR and icaA for biofilm phenotype-related genes. (C) Northern blots of the regulatory locus (agr RNAIII), protein A (spa), α-hemolysin (hla), and V8 protease (sspA) genes for the wild-type, teg49 mutant (ALC7907), teg49 mutant with pEPSA5::teg49 (ALC7912), and isogenic sarA mutant strains from various growth phases as indicated. All the strains containing pEPSA5 and its derivatives were grown in the presence of 2% xylose for the induction of teg49. A total of 10 μg of cellular RNA from various phases of growth was loaded onto each lane. The 23S and 16S rRNAs of an ethidium bromide-stained gel used for blotting are shown as the loading control. The numbers beside the gels are OD600 values.
FIG 5
FIG 5
Validation of RNA-Seq data by Northern blot and phenotypic assays. (A) Northern blots of RNA-Seq data on deduced teg49 target genes, including SAOUHSC_00401 (467-fold upregulated), SAOUHSC_02167 (3,214-fold upregulated), SAOUHSC-02160 (769-fold upregulated), SAOUHSC_02841 (32-fold downregulated), saeR (104-fold upregulated), and lytS (4-fold upregulated) for the wild-type, teg49 mutant (ALC7907), and isogenic sarA mutant strains at the exponential phase of growth. A total of 10 μg of cellular RNA was loaded onto each lane. The 23S and 16S bands of the ethidium bromide-stained gel used for blotting are shown as the loading control. The spliced images were taken from different regions of the same image. (B) Thirteen randomly selected RNA-Seq-analyzed genes, along with the gyrB control, were selected for qRT-PCR using total RNA isolated from the respective strains at the exponential phase of growth. The data were normalized against gyrB as the reference transcript for qRT-PCR. All the numbers on the x axis are the gene names from the S. aureus strain NCTC8325 genome (SAOUHSC). (C) Effect of teg49 inactivation on penicillin-induced lysis or growth inhibition. Penicillin G-induced lysis of wild-type SH1000, teg49 mutant (ALC7907), and isogenic sarA mutant (ALC2732 as the control) strains was measured as a decrease in the optical density at 650 nm over time. Penicillin G (0.04 μg/ml, or ∼10-fold subinhibitory concentration) was added to early-exponential-phase growing cultures (OD650 ≈ 0.25), and changes in the OD650 were monitored over a 7-h period. The percentage of growth inhibition or lysis by penicillin G over time was plotted and was calculated as the OD over time divided by the OD at the time penicillin G was added multiplied by 100. The experiments were repeated at least three times. The results are expressed as means and standard errors of the mean.
FIG 6
FIG 6
The teg49 and HP1 mutants exhibited reduced virulence in a mouse model of skin abscess infection. Mice (6 in each group) were challenged with ∼1 × 10⁸ CFU of S. aureus SH1000 or its isogenic teg49 or HP1 mutant and observed daily for the presence of skin abscesses. Shown are the mean numbers of colonies counted per gram of infected skin tissue with standard errors of the mean. The mean counts per gram of tissue for the teg49 and HP1 mutants were considered to be statistically significantly different from that of the parent.

Similar articles

Cited by

References

    1. Crossley KB, Archer GL. 1997. The staphylococci in human disease. Churchill Livingston, New York, NY.
    1. Lowy FD. 1998. Staphylococcus aureus infections. N Engl J Med 339:520–532. doi:10.1056/NEJM199808203390806. - DOI - PubMed
    1. Foster TJ. 2005. Immune evasion by staphylococci. Nat Rev Microbiol 3:948–958. doi:10.1038/nrmicro1289. - DOI - PubMed
    1. Kennedy AD, DeLeo FR. 2009. Neutrophil apoptosis and the resolution of infection. Immunol Res 43:25–61. doi:10.1007/s12026-008-8049-6. - DOI - PubMed
    1. Diep BA, Otto M. 2008. The role of virulence determinants in community-associated MRSA pathogenesis. Trends Microbiol 16:361–369. doi:10.1016/j.tim.2008.05.002. - DOI - PMC - PubMed

Publication types

MeSH terms

LinkOut - more resources