. 2018 Feb;176(2):1694-1708.
doi: 10.1104/pp.17.00823. Epub 2017 Nov 13.

Spatial Control of Gene Expression by miR319-Regulated TCP Transcription Factors in Leaf Development

Affiliations

Spatial Control of Gene Expression by miR319-Regulated TCP Transcription Factors in Leaf Development

Edgardo G Bresso et al. Plant Physiol. 2018 Feb.

Abstract

The characteristic leaf shapes we see in all plants are in good part the outcome of the combined action of several transcription factor networks that translate into cell division activity during the early development of the organ. We show here that wild-type leaves have distinct transcriptomic profiles in center and marginal regions. Certain transcripts are enriched in margins, including those of CINCINNATA-like TCPs (TEOSINTE BRANCHED, CYCLOIDEA and PCF1/2) and members of the NGATHA and STYLISH gene families. We study in detail the contribution of microRNA319 (miR319)-regulated TCP transcription factors to the development of the center and marginal regions of Arabidopsis (Arabidopsis thaliana) leaves. We compare in molecular analyses the wild type, the tcp2 tcp4 mutant that has enlarged flat leaves, and the tcp2 tcp3 tcp4 tcp10 mutant with strongly crinkled leaves. The different leaf domains of the tcp mutants show changed expression patterns for many photosynthesis-related genes, indicating delayed differentiation, especially in the marginal parts of the organ. At the same time, we found an up-regulation of cyclin genes and other genes that are known to participate in cell division, specifically in the marginal regions of tcp2 tcp3 tcp4 tcp10 Using GUS reporter constructs, we confirmed extended mitotic activity in the tcp2 tcp3 tcp4 tcp10 leaf, which persisted in small defined foci in the margins when the mitotic activity had already ceased in wild-type leaves. Our results describe the role of miR319-regulated TCP transcription factors in the coordination of activities in different leaf domains during organ development.


Figures

Figure 1.
Figure 1.
Effects of decreasing TCP levels on leaf size and shape. A, Four-week-old rosettes of Arabidopsis plants with decreased levels of TCP activity. B, Disassembled rosettes of the indicated genotypes. C, Leaf area of and two of the indicated genotypes. Marked in orange are the contributions of folded regions to the total leaf area (see “Materials and Methods”). D, Number of cells in the same leaves as in C. E, Cell area of the same leaves as in C. The asterisk indicates statistical significance of the difference according to P < 0.01 by Student’s t test. wt, Wild type. F, Cleared and flattened leaves of the different genotypes that have reduced TCP activity. Yellow arrows indicate folded regions. Violet bars illustrate how leaf size and curvature develop with respect to the gradual reduction of TCP activity. The mutants tcp2 tcp4, tcp2 tcp4 tcp10, and tcp2 tcp3 tcp4 tcp10 are labeled tcp2-4, tcp2-4-10, and tcp2-3-4-10, respectively.
Figure 2.
Figure 2.
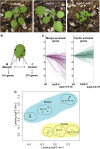
Transcriptome analysis of leaf domains of the wild type and tcp mutants. A, Rosettes with emerging leaf 5 as used for transcriptome analysis by RNAseq experiments. B, Schematic display of regions that were used as marginal and center samples to obtain RNA for the RNAseq experiments. In the wild type, 237 center- and 141 margin-enriched genes were identified. C, Graphical display showing fold change of the behavior of genes that were determined in B to be margin or center enriched in wild-type samples (wt) or in tcp2 tcp4 and tcp2 tcp3 tcp4 tcp10 mutants. The black lines represent the average expression levels of all margin- and center-enriched genes. D, Multidimensional scaling plot for count data (all genes). Distances correspond to leading log fold change (logFC) between each pair of RNA samples.
Figure 3.
Figure 3.
Coordination of gene expression related to photosynthesis by miR319-regulated TCPs. A, Venn diagram showing the intersections of down-regulated genes in margins and centers of tcp2 tcp4 and tcp2 tcp3 tcp4 tcp10 compared with the wild type. B, Promoter analysis of down-regulated genes in tcp2 tcp4 and tcp2 tcp3 tcp4 tcp10 center and margin regions for overrepresentation of the TCP binding motif GGACCA. C, Graphical display of MapMan analysis of gene expression for photosynthesis-related genes in tcp2 tcp3 tcp4 tcp10 margins compared with the wild type. D, Graphical display of relative expression changes of photosynthesis-related genes between center and marginal regions in the wild type (wt), tcp2 tcp4, and tcp2 tcp3 tcp4 tcp10 as determined by RNAseq experiments. The mutants tcp2 tcp4 and tcp2 tcp3 tcp4 tcp10 are labeled tcp2-4 and tcp2-3-4-10, respectively. E, Chlorophyll contents in developing young leaves as estimated by their fluorescence using a light scanning confocal microscope. Left, Wild type with closeup; right, tcp2 tcp3 tcp4 tcp10 with closeup. The colored bar indicates the fluorescence intensity profile used from blue (low fluorescence) to white (high fluorescence).
Figure 4.
Figure 4.
Up-regulation of the leaf developmental program and mitotic genes in tcp mutant margins. A, Venn diagram showing the intersections of up-regulated genes in margins and centers of tcp2 tcp4 and tcp2 tcp3 tcp4 tcp10 compared with the wild type. B, Output of GO enrichment analysis for up-regulated genes in tcp2 tcp3 tcp4 tcp10 margin and center regions. C, Display of expression changes of B-type cyclin genes in tcp2 tcp4 and tcp2 tcp3 tcp4 tcp10 center and marginal leaf samples in RNAseq analysis. The y axis shows log fold change (logFC) compared with the wild type (WT). D, Display of expression changes of selected genes that are active in early stages of leaf development in tcp2 tcp4 and tcp2 tcp3 tcp4 tcp10 center and marginal leaf samples. The y axis shows log fold change of mutant samples compared with the wild type. The mutants tcp2 tcp4 and tcp2 tcp3 tcp4 tcp10 are labeled tcp2-4 and tcp2-3-4-10, respectively.
Figure 5.
Figure 5.
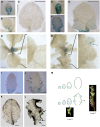
Activation of discrete foci expressing CYCLINB1;1:GUS upon TCP down-regulation. A to L, GUS assays. A to D, I, and K, Young developing leaves of a CYCLINB1;1:GUS reporter line. E to H, J, and L, Young leaves of the same CYCLINB1;1:GUS reporter overexpressing miR319a, resulting in crinkly leaves. A, Leaf 1 at 7 d after sowing (DAS). B, Leaf 1 at 9 DAS. C, Leaf 1 at 11 DAS. D, Leaf 4. E, Leaf 1 of miR319 overexpressor at 8 DAS. F, Leaf 1 of miR319 overexpressor at 10 DAS. G, Leaf 1 of miR319 overexpressor at 12 DAS. The dashed lines delimit the domain containing cycling cells. H, Leaf 4 of miR319 overexpressor. I, Leaf 7. J, Leaf 7 of miR319 overexpressor. K and L, More mature leaves of the wild type (K) and miR319a overexpressor (L). M, Models showing the effect of miR319-regulated TCPs on cell division in the developing leaf of the wild type (top) and tcp quadruple knockouts or miR319-overexpressing plants (bottom). Blue dots indicate proliferating cells. Bars = 0.2 mm (A, E, I, and J), 0.5 mm (B, C, F, and G), and 1 mm (D, H, K, and L).
Figure 6.
Figure 6.
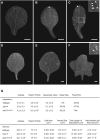
Modification of the venation pattern in tcp mutants. A to C, Cleared cotyledons of the wild type (A), tcp2 tcp4 (B), and tcp2 tcp3 tcp4 tcp10 (C). D to F, Cleared first leaves of the wild type (D), tcp2 tcp4 (E), and tcp2 tcp3 tcp4 tcp10 (F). G, Table summarizing the scored parameters describing the venation pattern. Bars = 1 mm.

Similar articles

Cited by

References

    1. Alvarez JP, Furumizu C, Efroni I, Eshed Y, Bowman JL (2016) Active suppression of a leaf meristem orchestrates determinate leaf growth. eLife 5: e15023. - PMC - PubMed
    1. Alvarez JP, Goldshmidt A, Efroni I, Bowman JL, Eshed Y (2009) The NGATHA distal organ development genes are essential for style specification in Arabidopsis. Plant Cell 21: 1373–1393 - PMC - PubMed
    1. Alvarez JP, Pekker I, Goldshmidt A, Blum E, Amsellem Z, Eshed Y (2006) Endogenous and synthetic microRNAs stimulate simultaneous, efficient, and localized regulation of multiple targets in diverse species. Plant Cell 18: 1134–1151 - PMC - PubMed
    1. Anders S, McCarthy DJ, Chen Y, Okoniewski M, Smyth GK, Huber W, Robinson MD (2013) Count-based differential expression analysis of RNA sequencing data using R and Bioconductor. Nat Protoc 8: 1765–1786 - PubMed
    1. Andriankaja M, Dhondt S, De Bodt S, Vanhaeren H, Coppens F, De Milde L, Mühlenbock P, Skirycz A, Gonzalez N, Beemster GT, et al. (2012) Exit from proliferation during leaf development in Arabidopsis thaliana: a not-so-gradual process. Dev Cell 22: 64–78 - PubMed

Publication types

MeSH terms