

Assessing the present and future probability of Hurricane Harvey's rainfall
- PMID: 29133388
- PMCID: PMC5715789
- DOI: 10.1073/pnas.1716222114
Assessing the present and future probability of Hurricane Harvey's rainfall
Abstract
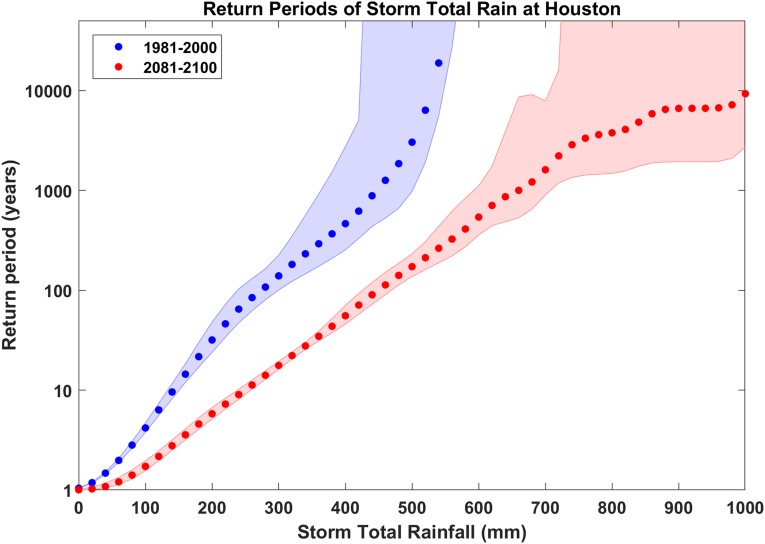
We estimate, for current and future climates, the annual probability of areally averaged hurricane rain of Hurricane Harvey's magnitude by downscaling large numbers of tropical cyclones from three climate reanalyses and six climate models. For the state of Texas, we estimate that the annual probability of 500 mm of area-integrated rainfall was about 1% in the period 1981-2000 and will increase to 18% over the period 2081-2100 under Intergovernmental Panel on Climate Change (IPCC) AR5 representative concentration pathway 8.5. If the frequency of such event is increasingly linearly between these two periods, then in 2017 the annual probability would be 6%, a sixfold increase since the late 20th century.
Keywords: climate change; floods; hurricanes.
Copyright © 2017 the Author(s). Published by PNAS.
Conflict of interest statement
Conflict of interest statement: K.E. is an officer of WindRiskTech, LLC, a firm that provides hurricane risk assessments to clients worldwide. The firm also provides data sets free of charge to scientific researchers.
Figures
References
-
- FOX News Network (September 6, 2017) Gov. Abbott: Harvey recovery will cost far more than Katrina [video recording, transcript]. Available at www.foxnews.com/transcript/2017/09/06/gov-abbott-harvey-recovery-will-co.... Accessed September 12, 2017.
-
- Foufoula-Georgiou E. A probabilistic storm transposition approach for estimating exceedance probabilities of extreme precipitation depths. Water Resour Res. 1989;25:799–815.
-
- Roth D. Texas Hurricane History. National Weather Service; Camp Springs, MD: 2009.
-
- Houser T, Hsiang S, Kopp R, Larsen K. American Climate Prospectus: Economic Risks in the United States. Rhodium Group LLC; New York: 2014. p. 197.
-
- Knutson TR, et al. Tropical cyclones and climate change. Nat Geosci. 2010;3:157–163.
Publication types
LinkOut - more resources
Full Text Sources
Other Literature Sources
