. 2017 Nov 28;114(48):E10369-E10378.
doi: 10.1073/pnas.1712881114. Epub 2017 Nov 13.

Recovery of taste organs and sensory function after severe loss from Hedgehog/Smoothened inhibition with cancer drug sonidegib

Affiliations

Recovery of taste organs and sensory function after severe loss from Hedgehog/Smoothened inhibition with cancer drug sonidegib

Archana Kumari et al. Proc Natl Acad Sci U S A. .

Abstract

Striking taste disturbances are reported in cancer patients treated with Hedgehog (HH)-pathway inhibitor drugs, including sonidegib (LDE225), which block the HH pathway effector Smoothened (SMO). We tested the potential for molecular, cellular, and functional recovery in mice from the severe disruption of taste-organ biology and taste sensation that follows HH/SMO signaling inhibition. Sonidegib treatment led to rapid loss of taste buds (TB) in both fungiform and circumvallate papillae, including disruption of TB progenitor-cell proliferation and differentiation. Effects were selective, sparing nontaste papillae. To confirm that taste-organ effects of sonidegib treatment result from HH/SMO signaling inhibition, we studied mice with conditional global or epithelium-specific Smo deletions and observed similar effects. During sonidegib treatment, chorda tympani nerve responses to lingual chemical stimulation were maintained at 10 d but were eliminated after 16 d, associated with nearly complete TB loss. Notably, responses to tactile or cold stimulus modalities were retained. Further, innervation, which was maintained in the papilla core throughout treatment, was not sufficient to sustain TB during HH/SMO inhibition. Importantly, treatment cessation led to rapid and complete restoration of taste responses within 14 d associated with morphologic recovery in about 55% of TB. However, although taste nerve responses were sustained, TB were not restored in all fungiform papillae even with prolonged recovery for several months. This study establishes a physiologic, selective requirement for HH/SMO signaling in taste homeostasis that includes potential for sensory restoration and can explain the temporal recovery after taste dysgeusia in patients treated with HH/SMO inhibitors.

Keywords: chorda tympani nerve; circumvallate papilla; fungiform papilla; taste receptor cell; taste regeneration.


Conflict of interest statement

The authors declare no conflict of interest.

Figures

Fig. 1.
Fig. 1.
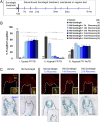
Sonidegib alters FP and TB morphology and reduces all TB cell types. (A) The HH pathway in OFF and ON signaling and INHIBITED at SMO by sonidegib. (B) Schematic: FP and filiform papillae with HH signaling components. (C) H&E staining for FP/TB categories. Dotted lines demarcate TB or regions of TB remnants. Blue dashed surface lines indicate epithelial keratinization in FP; a red dashed line indicates epithelial keratinization in filiform papilla in type III atypical FP/no TB. (Scale bar: 50 μm.) (D) Percentage of FP/TB categories: typical FP/TB (category I), atypical FP/TB (category II), and atypical FP/no TB (category III), after vehicle or sonidegib treatment. Bars are mean ± SEM. Numbers of tongues per group are in parentheses. Brackets indicate significant differences for treatment durations (two-way ANOVA and Tukey’s HSD post hoc tests); ###P < 0.001 for vehicle vs. sonidegib treatments. Complete F and P values are given in Fig. S1A. (E) Antibody detection of TB cell types: NTPdase2 (type 1), PLCβ2 (type 2), SNAP25 (type 3) after vehicle or sonidegib treatment. Cell nuclei are identified with DAPI (blue). (Insets) TB cell types 2 and 3 were eliminated after 28 d of sonidegib treatment. Type 1 cells (NTPdase2) were eliminated after 36 d. (Scale bar: 50 μm.) (F) Number of TB cell types after 16 or 28 d of sonidegib treatment compared with vehicle treatment. Data are mean ± SEM. Numbers of tongues are in parentheses in bars. Brackets indicate significant differences (one-way ANOVA with Tukey’s HSD post hoc tests). Complete F and P values are given in Fig. S1C.
Fig. 2.
Fig. 2.
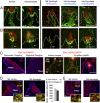
Sonidegib treatment reduces apical epithelial cell proliferation in FP and leads to the accumulation of suprabasal K5+ cells. (A) Immunofluorescent antibody detection of E-cadherin (Ecad, red) and Ki67 (green) in basal epithelial cells of FP and filiform papillae after vehicle or 5 d, 16 d, or 28 d sonidegib treatments. The image for FP, vehicle, shows three regions for quantifying Ki67+ cells (apical, basal, and perigemmal). (Inset) Twenty-eight days sonidegib illustrates the absence of Ki67+ perigemmal cells in some category III FP (atypical FP/no TB). The vehicle image for filiform papillae illustrates Ki67+ cells, clustered at the base of rete ridges (arrows). White dotted lines indicate the surface of the epithelium. (Scale bar: 50 μm, also applies to C.) (Magnification: Inset, 0.9×.) (B) Number of Ki67+ cells in FP regions in vehicle- and sonidegib-treated mice. Counts in the perigemmal region were done only when TB or TB remnants remained in the papilla, i.e., in category I (typical FP/TB) or category II (atypical FP/TB) FP. In filiform papillae Ki67+ proliferating cells were quantified in a 300-μm length of tongue. Numbers of tongues are in parentheses. Statistical analysis was performed with one-way ANOVA with Tukey’s HSD post hoc tests (*P ≤ 0.05, **P ≤ 0.01, ***P ≤ 0.001). F and P values are shown in the table at the right of the graphs. (C) Antibody detection in FP of K5 (green, arrows point to K5+ cells in TB or TB remnants) in TB cells after vehicle or 5, 10, 16, or 28 d sonidegib treatment. (Insets) K5 coexpression with a few K8+ TB cells (red) indicated by arrows. (Magnification: Insets, 3.5×.)
Fig. 3.
Fig. 3.
Smo deletion alters FP morphology and reduces TB. (A) Diagrams showing the conditional deletion of Smo from all tissues (cSmoKO) or from epithelial cells and progeny (cSmoKO-epi). The gray/shaded region on the cSmoKO-epi diagram indicates normal Smo expression. (B) Percentage of category I (typical FP/TB), category II (atypical FP/TB), and category III (atypical FP/no TB) FP in cSmoKO or cSmoKO-epi mice. Bars are mean ± SEM. Numbers of tongues are in parentheses. Brackets indicate significant differences (two-way ANOVA with Tukey’s HSD post hoc tests); ###P ≤ 0.001 for control vs. cSmoKO or cSmoKO-epi. Complete F and P values are given in Fig. S3A.
Fig. 4.
Fig. 4.
Smo deletion leads to reduced TB, HH ligand, HH-responding cells and reduced proliferation in FP, while innervation is retained. (A) Immunofluorescent antibody detection of SHH (red) and K8 (green) in TB cells; X-Gal staining (blue) of Gli1lacZ-positive cells from control, cSmoKO, and cSmoKO-epi mice. (Insets) Merged images for SHH and K8. No TB cells remain in the cSmoKO image (white box, Inset). (B) Antibody detection of E-cadherin (Ecad, red) and Ki67 (green) in control and Smo deletions. Ki67+ cells were reduced in apical FP walls shown by white bars. (C) Antibody detection of K8+ (red) TB cells and nerves (NF, green or P2X3, green) in cSmoKO or cSmoKO-epi mice. Arrows indicate P2X3 fibers in the FP core. (Scale bar: 50 μm, all images.) (D) Antibody detection of nerves. NF (green) with X-Gal staining (blue) of Gli1lacZ in control and 16-d cSmoKO mice. (Inset) Enlarged image of the boxed region shows the association of Gli1lacZ-positive, HH-responding cells with nerves (NF+) in FP stroma (arrows). Dotted lines in in A, C, and D indicate the basal lamina. (Magnification: D, Inset, 5×.)
Fig. 5.
Fig. 5.
Pharmacologic and genetic HH pathway blockade decreases TB in CV papillae. (A) H&E staining for CV/TB morphology in vehicle-treated mice. Bars delimit the CV walls, for measuring wall length. (Inset) An enlarged image of the boxed region illustrating TB profiles (dotted lines) and TB pores (arrows). (Scale bars: 50 μm.) (B) H&E staining for CV/TB morphology after 16 d of HPI by sonidegib or whole-body (cSmoKO) or epithelial Smo (cSmoKO-epi) deletion. (Scale bar: 50 μm for all images in A and B.) (C and D) Graphs for depth and wall length (C) and TB profiles and TB pores (D). Brackets in D denote significant differences (one-way ANOVA with Tukey’s HSD post hoc tests). Bars are mean ± SEM. F and P values are given in Fig. S4 A and B. (E) X-Gal staining (blue) for Gli1lacZ illustrates HH-responding cells in epithelium and stroma in control and 24-d cSmoKO-epi mice. Dotted lines outline the epithelium. (Scale bar: 50 μm for both images.)
Fig. 6.
Fig. 6.
Cessation of sonidegib treatment results in the recovery of FP/TB morphology, SHH ligand, and HH-responding cells within 14 d and continuing up to 9 mo. (A) Time line for studying recovery from the effects of 16 d sonidegib treatment. (B) Percentage of category I (typical FP/TB), category II (atypical FP/TB), and category III (atypical FP/no TB) FP after 16 d of sonidegib treatment followed by recovery periods of 7, 14, or 21 d and 3, 5, or 9 mo. Examples of FP/TB morphology are shown in Fig. S5A. Bars are mean ± SEM. Numbers in parentheses are number of mice analyzed. Brackets denote significant differences for treatment durations (two-way ANOVA with Tukey’s HSD post hoc tests); ###P ≤ 0.001 for vehicle vs. sonidegib treatments. Complete F and P values are given in Fig. S6A. (C) Antibody detection of SHH (red) and K8 (green, Inset) for TB cells and X-Gal staining (blue) for Gli1lacZ after 16 d of sonidegib treatment and recovery for 7, 14, or 21 d. The Gli1lacZ Inset at 7 d recovery is included to illustrate the variability in the recovery phenotype at 7 d. Dotted lines demarcate the basal lamina. (Scale bar: 50 μm.) (Magnification: C, Lower, Inset, 0.6×.)
Fig. 7.
Fig. 7.
Retained innervation during and after sonidegib treatment and identification of Shh expression in GG and TG and in anterior tongue and FP nerve fibers. (A and B). Immunofluorescent antibody detection of TB cells (K8, red) and nerves (NF, green, in A; or P2X3, green, in B). Even in category III (atypical FP/no TB) FP, with no K8+ cells retained during sonidegib exposure or recovery periods, the innervation was intact, as illustrated in Fig. S7A. Dotted lines indicate the basal lamina. Arrows in B point to P2X3 fibers. (Scale bars: 50 μm.) (C) RFP (red) expression in constitutive ShhCre;R26RFP mice and after tamoxifen (TAM) administration in ShhCreER;R26RFP mice. In both GG and TG, all cell bodies expressed Shh. Anterior tongue TB include Shh+ cells and their progeny. Arrows denote Shh+ nerve fibers in the anterior tongue, FP core, and surrounding the TB reaching into the apical epithelium. Dotted lines demarcate the basal lamina. (Scale bars: 50 μm.) (D) Immunofluorescent antibody detection of SHH (red) demonstrates SHH+ cells in GG in vehicle- or sonidegib-treated mice. Insets show merged and magnified images for SHH and NeuN (green). (Scale bar: 50 μm.) The graph indicates that number of SHH+ cells in four noncontiguous 10-μm sections of GG did not change after 16 d sonidegib treatment compared with vehicle (t test; t = 1.32, P = 0.26). Bars represent mean ± SEM. Numbers in parentheses are the number of mice per group. (Magnification: Insets, 2×.) (E) Immunofluorescent antibody detection of SHH (red) demonstrates SHH+ cells in TG. Insets show merged and magnified images for SHH and NeuN (green). (Scale bar: 50 μm.) (Magnification: Insets, 3×.)
Fig. 8.
Fig. 8.
Chorda tympani nerve responses to lingual stimulation with chemical, tactile, and cold stimuli after HPI with sonidegib and recovery. Chemical response: Integrated electrophysiological whole-nerve recordings in response to chemical stimuli applied to the tongue for 20 s followed by a distilled water rinse for 30 s. The height at the steady-state integrated recording for an individual stimulus above baseline was measured as response. Tactile response: Whole-nerve, not integrated, responses to tactile stimuli, which consisted of five strokes with a wooden rod, on the anterior tongue. Cold response: Integrated recordings to water at 4 °C applied for 20 s.

Similar articles

Cited by

References

    1. Migden MR, et al. Treatment with two different doses of sonidegib in patients with locally advanced or metastatic basal cell carcinoma (BOLT): A multicentre, randomised, double-blind phase 2 trial. Lancet Oncol. 2015;16:716–728. - PubMed
    1. Rodon J, et al. A phase I, multicenter, open-label, first-in-human, dose-escalation study of the oral smoothened inhibitor Sonidegib (LDE225) in patients with advanced solid tumors. Clin Cancer Res. 2014;20:1900–1909. - PubMed
    1. Sekulic A, et al. Efficacy and safety of vismodegib in advanced basal-cell carcinoma. N Engl J Med. 2012;366:2171–2179. - PMC - PubMed
    1. Tang JY, et al. Inhibiting the hedgehog pathway in patients with the basal-cell nevus syndrome. N Engl J Med. 2012;366:2180–2188. - PMC - PubMed
    1. Fife K, et al. Managing adverse events associated with vismodegib in the treatment of basal cell carcinoma. Future Oncol. 2017;13:175–184. - PubMed

Publication types

MeSH terms

LinkOut - more resources