. 2017 Nov 28;114(48):E10281-E10290.
doi: 10.1073/pnas.1713328114. Epub 2017 Nov 13.

Closed-loop control of targeted ultrasound drug delivery across the blood-brain/tumor barriers in a rat glioma model

Affiliations

Closed-loop control of targeted ultrasound drug delivery across the blood-brain/tumor barriers in a rat glioma model

Tao Sun et al. Proc Natl Acad Sci U S A. .

Abstract

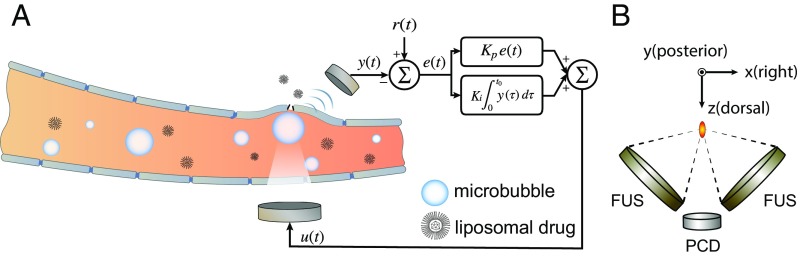
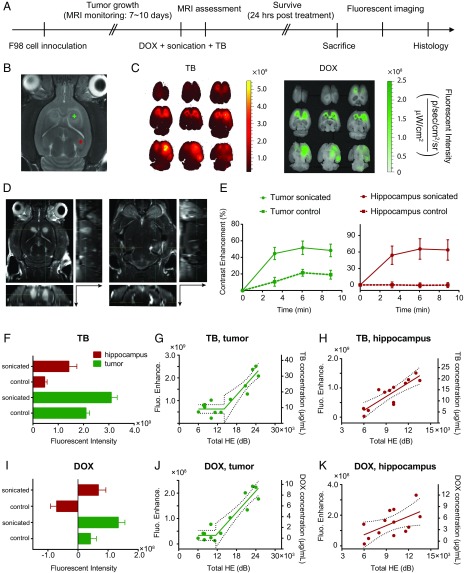
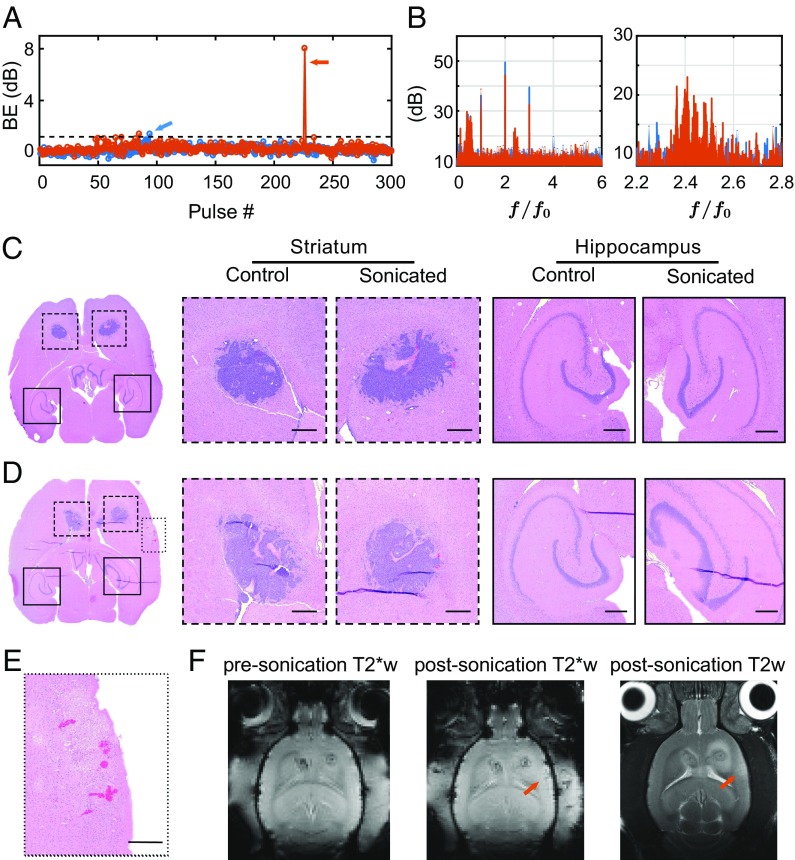
Cavitation-facilitated microbubble-mediated focused ultrasound therapy is a promising method of drug delivery across the blood-brain barrier (BBB) for treating many neurological disorders. Unlike ultrasound thermal therapies, during which magnetic resonance thermometry can serve as a reliable treatment control modality, real-time control of modulated BBB disruption with undetectable vascular damage remains a challenge. Here a closed-loop cavitation controlling paradigm that sustains stable cavitation while suppressing inertial cavitation behavior was designed and validated using a dual-transducer system operating at the clinically relevant ultrasound frequency of 274.3 kHz. Tests in the normal brain and in the F98 glioma model in vivo demonstrated that this controller enables reliable and damage-free delivery of a predetermined amount of the chemotherapeutic drug (liposomal doxorubicin) into the brain. The maximum concentration level of delivered doxorubicin exceeded levels previously shown (using uncontrolled sonication) to induce tumor regression and improve survival in rat glioma. These results confirmed the ability of the controller to modulate the drug delivery dosage within a therapeutically effective range, while improving safety control. It can be readily implemented clinically and potentially applied to other cavitation-enhanced ultrasound therapies.

Keywords: acoustic cavitation; blood–brain barrier; drug delivery; focused ultrasound; treatment control.


Conflict of interest statement

Conflict of interest statement: Two provisional patents describing the controlling system and focused ultrasound system developed in this work have been filed (inventors: N.J.M. and T.S.). N.J.M. holds another two published patents on the ultrasound technique evaluated in this work. No conflicts of interest were disclosed by the other authors.

Figures

Fig. 1.
Fig. 1.
The controller system. (A) Schematic representation of the feedback controlled drug delivery system. Serving as the acoustic indicator of drug delivery dosage, microbubble emission signal y(t) was recorded and compared with the expected value r(t). Their difference e(t) was used to calculate the controller output u(t), which was fed back to the focused ultrasound transducer for controlling the transmission. (B) Illustration of the dual-aperture focused ultrasound setup with a passive cavitation recording transducer.
Fig. 2.
Fig. 2.
Open-loop feasibility test in vivo. (A) Representative examples showing HE recorded during sonication in the striatum as a function of acoustic pressure with a 50 (in blue), 100 (in red), or 200 (in orange) µL/kg bolus microbubble administration. Black lines were shown as the corresponding linear regressions. (B) Coefficient of determination R2 of the linear correlations between HE and acoustic pressure for the three bubble doses. The most linear relationship occurred with 200 µL/kg microbubble administrations for both striatum (R2=0.94±0.03) and hippocampus (R2=0.95±0.02) targets. (Box limits, 25 and 75 percentiles; whiskers, 5 and 95 percentiles; center line, median; +, mean.) (C) Maximum HE reached before BE was detected. (D) BE thresholds, i.e., lowest pressures at which BE was detected. Error bars represent 95% confidence intervals. Two-way ANOVA with post hoc multicomparisons was used to assess significant difference. (**P < 0.01; ***P < 0.001; ****P < 0.0001.)
Fig. 3.
Fig. 3.
Optimizing the acoustic performance of the closed-loop controller. (A) Representative HE profiles for two sonications of the same target with 1-Hz (in blue) versus 4-Hz (in green) PRF. The desired HE range was shown as black dashed lines. (B) Histograms of the two HE profiles shown in A. (C) Sonication input (acoustic pressure) profiles for the two examples shown in A. (D) Representative HE profiles for two sonications of the same target using 4-Hz PRF with bolus (in blue) versus infusion (in green) administration of Optison microbubbles. (E) Histograms of the two HE profiles shown in D. (F) Sonication input profiles for the two examples shown in D. (G and H) Statistical comparisons for all of the 1- and 4-Hz PRF sonications for both bolus and infusion administrations (1 Hz + bolus, n = 55; 4 Hz + bolus, n = 53; 1 Hz + infusion, n = 6; 4 Hz + infusion, n = 36). (G) Statistical comparison of the good burst rate (GBR), which measured the percentage of pulses where HE was in the desired range. ANOVA showed statistical significance for both factors, PRF (P = 0.001) and microbubble administration mode (P = 0.001). Multicomparison tests suggested 4-Hz PRF using infusion injection significantly improved the GBR compared with the bolus injection groups. (H) HE stability comparison assessed by the SD of the HE signals. ANOVA showed significance for PRF (P = 0.003) but not bubble administration mode (P = 0.07). Multicomparison tests suggested that 4 Hz with microbubble infusion was superior in sustaining HE stability to 1 Hz with bolus injection. (Box limits, 25 and 75 percentiles; whiskers, 5 and 95 percentiles; center line, median; +, mean. Statistical significance was assessed via two-way ANOVA with a Tukey multicomparison test; ***P < 0.001; ****P < 0.0001.)
Fig. 4.
Fig. 4.
Controlling model drug delivery across the BBB. (A) Schematic illustration of the experimental protocol. (B) The correlation between fluorescent intensity enhancement (Fluo. Enhance.) and the total HE. Data in red were acquired from sonications in the striatum and hippocampus with different sonication durations (60, 90, or 120 s; n = 7 for each duration). The calibrated delivery reference curve was then constructed by fitting a piecewise linear regression (dotted lines, 95% confidence intervals). Solid red dots represent cases whose fluorescent intensities were more than two SDs above the mean of those in the nonsonicated control group (n = 10 for each target); otherwise, data are shown as hollow red dots. Data marked in green show TB delivery in experiments where sonication was performed until total HE reached a preset goal: 1,500 dB (n = 4), 2,100 dB (n = 8), or 2,700 dB (n = 5). Error bars represent SEM. (C) Representative H&E-stained brain slices showing no vascular/neuronal damage. (Scale bar, 500 µm.)
Fig. 5.
Fig. 5.
Controlling chemotherapeutic drug delivery in F98 rat glioma model. (A) Schematic illustration of the experimental protocol. (B) For treatment planning, an axial representative T2-weighted MR image was acquired on the sonication day for visualizing the anatomical structures and locations of the bilateral tumors. Plus refers to the targeted location. (C) Representative fluorescent imaging for TB (Left) and DOX (Right). (D) Contrast-enhanced T1-weighted MR images acquired posttreatment for assessing BTBD/BBBD on the tumor (Left) and hippocampus (Right) targets. The axial images were reformatted to show sagittal (Right) and coronal (Bottom) planes. The arrows indicate the direction toward the ventral surface. All MRI and fluorescent images shown in Fig. 5 were obtained from the same animal. (E) MRI contrast enhancement (in percent, compared with the baseline images acquired before contrast agent administration) evaluations at three time points post–contrast agent injection. Fluorescent intensities of TB (F) and DOX (I) in control and sonicated locations were compared. Error bars represent SDs. The relationships between the delivered TB concentration (right axis)/fluorescent enhancement (left axis) and total HE for (G) tumor and (H) hippocampus targets were assessed (solid lines, piecewise linear regression; dotted lines, 95% confidence intervals). The relationships between delivered DOX concentrations (right axes)/fluorescent enhancement (left axes) and total HE for (J) tumor and (K) hippocampus targets were also evaluated.
Fig. 6.
Fig. 6.
Safety assessments. (A) Two representative examples of BE profiles. The dashed line represents the threshold set in the controller algorithm, above which we considered BE to have occurred. (B) Microbubble emission spectra for the bursts indicated by arrows in A. Representative H&E evaluations of brain slices when (C) BE was not detected and (D) a low level of BE was observed. (E) H&E stained section showing erythrocytes in an off-target area for a case when large BE was observed (cavitation emissions shown in orange in A and B). (Scale bar, 500 µm.) (F) T2*- and T2-weighted MR images showed hypointense and hyperintense regions, respectively, in the area where we detected red blood cell extravasations.

Similar articles

Cited by

References

    1. Elias WJ, et al. A pilot study of focused ultrasound thalamotomy for essential tremor. N Engl J Med. 2013;369:640–648. - PubMed
    1. McDannold N, et al. Uterine leiomyomas: MR imaging-based thermometry and thermal dosimetry during focused ultrasound thermal ablation. Radiology. 2006;240:263–272. - PMC - PubMed
    1. Wong AW, et al. Ultrasound ablation enhances drug accumulation and survival in mammary carcinoma models. J Clin Invest. 2016;126:99–111. - PMC - PubMed
    1. Leslie T, et al. High-intensity focused ultrasound treatment of liver tumours: Post-treatment MRI correlates well with intra-operative estimates of treatment volume. Br J Radiol. 2012;85:1363–1370. - PMC - PubMed
    1. Hynynen K, McDannold N, Vykhodtseva N, Jolesz FA. Noninvasive MR imaging-guided focal opening of the blood-brain barrier in rabbits. Radiology. 2001;220:640–646. - PubMed

Publication types

MeSH terms