. 2017 Nov 28;114(48):12797-12802.
doi: 10.1073/pnas.1705364114. Epub 2017 Nov 13.

Repression of miR-31 by BCL6 stabilizes the helper function of human follicular helper T cells

Affiliations

Repression of miR-31 by BCL6 stabilizes the helper function of human follicular helper T cells

A Ripamonti et al. Proc Natl Acad Sci U S A. .

Abstract

Follicular helper T cells (TFHs) are a key component of adaptive immune responses as they help antibody production by B cells. Differentiation and function of TFH cells are controlled by the master gene BCL6, but it is largely unclear how this transcription repressor specifies the TFH program. Here we asked whether BCL6 controlled helper function through down-regulation of specific microRNAs (miRNAs). We first assessed miRNA expression in TFH cells and defined a TFH-specific miRNA signature. We report that hsa-miR-31-5p (miR-31) is down-regulated in TFH; we showed that BCL6 suppresses miR-31 expression by binding to its promoter; and we demonstrated that miR-31 inhibits the expression of molecules that control T-helper function, such as CD40L and SAP. These findings identify a BCL6-initiated inhibitory circuit that stabilizes the follicular helper T cell program at least in part through the control of miRNA transcription. Although BCL6 controls TFH activity in human and mouse, the role of miR-31 is restricted to human TFH cell differentiation, reflecting a species specificity of the miR-31 action. Our findings highlight miR-31 as a possible target to modulate human T cell dependent antibody responses in the settings of infection, vaccination, or immune dysregulation.

Keywords: BCL6; RNA-seq; human CD4+ TFH; microRNA; transcriptional regulation.


Conflict of interest statement

The authors declare no conflict of interest.

Figures
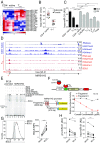
Fig. 1.
Fig. 1.
miR-31 is specifically down-regulated in human TFH cells by their master transcription factor BCL6. (A) Heat map of expression values (z scores of ΔCT) for signature miRNAs of CD4+ naïve and TFH cells sorted from secondary lymphoid organs (adenoids) of pediatric healthy donors (average age, 7 y) (Student’s paired t test, HCl with Pearson correlation) n = 6. (B) Quantitative RT-PCR analysis of miR-31 expression in CD4+ naïve T cells and TFH cells purified from secondary lymphoid organs of an independent set of pediatric healthy donors (adenoids, empty circles; n = 3 and tonsils, black circles; n = 9). Data in B are presented in arbitrary units (AU); error bars, SEM *P < 0.05 (Student’s paired t test). (C) Quantitative RT-PCR analysis of the expression of miR-31 in CD4+ naïve, TH1, and TFH cells purified from human secondary lymphoid organs (adenoids and tonsils), and in CD4+ naïve, CXCR5+, TH1, TH2, TH17, and Treg cells sorted from human PBMCs. Data in C are presented in arbitrary units (AU); error bars, SEM n ≥ 3, ***P < 0.001 and **P < 0.01 (Student’s paired t test). (D) Genomic tracks display ChIP-seq data of CD4+ naïve and TFH cells for different histone modifications (H3K27me3, H3K4me1, H3K4me3, and H3K27Ac) and BCL6 across human MIR31HG region. The red rectangle in the promoter region of MIR31HG indicates the location of predicted BCL6 binding sites. (E) Electrophoretic mobility shift assay (EMSA) and supershift assay for the analysis of BCL6 binding on miR-31 promoter region. EMSA was performed using fluorescent probes derived from canonical BCL6 binding motif of BCL6 gene promoter (BCL6 promoter lanes 2–4) or from BCL6 predicted binding site from MIR31HG gene promoter (MIR31HG lanes 5–11). Nuclear extracts of HEK293T that either do not expressed BCL6 (mock) or stably express BCL6 wild type (BCL6) or BCL6 deleted from the zinc fingers DNA binding domain (BCL6 ∆ZF) were used. For supershift assay (lanes 10 and 11), BCL6 antibody or a control antibody (HA-probe) was added to the reactions where nuclear extracts of HEK293T BCL6 were incubated with MIR31HG probe. Binding was quantified as percent of BCL6 binding to control, represented by the canonical motif of BCL6 gene promoter (lane 3). Data are representative of three independent experiments. (F) Schematic representation of the BCL6 transgene cloned downstream of the cumate-inducible CR5 promoter. CymR repressor is bound to the promoter in the absence of cumate and is relieved upon cumate addition, allowing BCL6 transcription. HEKCymR cell lines expressing the inducible BCL6 were cotransfected with a vector containing Firefly luciferase under the control of MIR31HG promoter fragments (fragments I and II) that contain no predicted BCL6 binding sites or the eight predicted binding sites, respectively. Twenty-four hours after BCL6 induction, a relative decrease of luciferase activity is observed only when the MIR31HG promoter fragment II is transfected (red line). Results are represented as the ratio of Firefly luciferase over Renilla luciferase activity. Data represent the average of 12 experiments ± SEM. (G, Left) Flow cytometric analysis of BCL6 expression, with BCL6 LVV-transduced CD4+ naïve T cells (black histogram) compared with cells transduced with a control LVV (MOCK LVV) (gray tinted histogram). This graph is representative of seven BCL6 overexpression experiments, with similar results. (G, Right) Mean fluorescence intensity (MFI) levels of BCL6 after overexpression of BCL6 using BCL6 LVV (BCL6) compared with MOCK LVV (MOCK) in CD4 naïve T cells from PBMCs. ***P < 0.0001 (Student’s paired t test) n = 7. (H) Quantitative RT-PCR analysis of pri–miR-31 (Left) and hsa–miR-31 (Right) expression in CD4+ naïve T cells transduced with MOCK LVV (Left black circles) or BCL6 LVV (Right black circles). *P < 0.05 and **P < 0.001 (Student’s paired t test) n = 7.
Fig. 2.
Fig. 2.
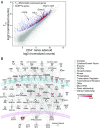
RNA-seq analysis of TFH cells. (A) Scatterplot of RNA-seq gene expression of CD4+ naïve and TFH cells. Total genes (gray), TFH up-regulated genes (blue), and hsa–miR-31 target genes up-regulated in TFH cells (red) are reported. (B) Molecular network based on direct interactions between selected genes is depicted. The color intensity is proportional to gene expression levels.
Fig. 3.
Fig. 3.
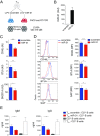
Overexpression of hsa–miR-31 in human TFH cells down-regulates BTLA, SAP, and CD40L expression and severely impaires TFH cell B-helper activity. (A) Schematic representation of TFH cells transduction with lentiviral vectors encoding for the precursor of hsa–miR-31 (miR-31, red cells) or control lentivirus (scramble, blue cells) and consequent experiments. (B) Quantitative RT-PCR analysis of miR-31 expression in TFH-transduced cells with control lentivirus (scramble) or lentivirus encoding for the precursor of hsa–miR-31 (miR-31). Data are presented in arbitrary units (AU); error bars, SEM n ≥ 3. (C) Quantitative RT-PCR analysis of CD40L (Upper), BTLA (Middle), or SH2D1A (Lower) expression in TFH cells 24 h after transduction with control lentivirus (scramble, blue histograms) or lentivirus encoding for the precursor of hsa–miR-31 (miR-31, red histograms). ***P < 0.0001, **P < 0.001, *P < 0.05; n = 6 (Student’s paired t test). Data are shown as mean + SEM. (D) Representative histograms (Left) and mean fluorescence intensity (Right) of CD40L (Upper, n = 8), BTLA (Middle, n = 9), and SAP (Lower, n = 10) expression analyzed by flow cytometry in TFH cells 24 h after transduction with control lentivirus (scramble, blue histograms) or lentivirus encoding for the precursor of hsa–miR-31 (miR-31, red histograms) (*P < 0.05, ***P <0.0001; Student's paired t test). (E) B-helper assay with hsa–miR-31 transduced TFH cells. GC B cells were cocultured with TFH transduced with a control lentivirus (TFH scramble) or a lentivirus expressing hsa–miR-31 (TFH miR-31). After 24 h, TFH scramble (blue histograms) and TFH miR-31 cells (red histograms) were separated from GC B cells and cocultured with syngenic CD27+ B cells in the presence of SEB 500 ng/mL IgM and IgG levels (nanograms per milliliter) and measured in the supernatants after 7 d by ELISA in the different culture conditions. Data are shown as mean + SEM. Controls are memory B cells alone (gray histograms) and memory B cells cocultured with untouched TFH cells (TFH T0) (white histograms); *P < 0.05 (Student’s paired t test). Data represent the average of five independent experiments.

Similar articles

Cited by

References

    1. Qi H. T follicular helper cells in space-time. Nat Rev Immunol. 2016;16:612–625. - PubMed
    1. Vinuesa CG, Tangye SG, Moser B, Mackay CR. Follicular B helper T cells in antibody responses and autoimmunity. Nat Rev Immunol. 2005;5:853–865. - PubMed
    1. Johnston RJ, et al. Bcl6 and Blimp-1 are reciprocal and antagonistic regulators of T follicular helper cell differentiation. Science. 2009;325:1006–1010. - PMC - PubMed
    1. Nurieva RI, et al. Bcl6 mediates the development of T follicular helper cells. Science. 2009;325:1001–1005. - PMC - PubMed
    1. Nance JP, Bélanger S, Johnston RJ, Takemori T, Crotty S. Cutting edge: T follicular helper cell differentiation is defective in the absence of Bcl6 BTB repressor domain function. J Immunol. 2015;194:5599–5603. - PMC - PubMed

Publication types

MeSH terms

LinkOut - more resources