. 2017 Nov 28;114(48):E10359-E10368.
doi: 10.1073/pnas.1620425114. Epub 2017 Nov 13.

Analysis of high-resolution 3D intrachromosomal interactions aided by Bayesian network modeling

Affiliations

Analysis of high-resolution 3D intrachromosomal interactions aided by Bayesian network modeling

Xizhe Zhang et al. Proc Natl Acad Sci U S A. .

Abstract

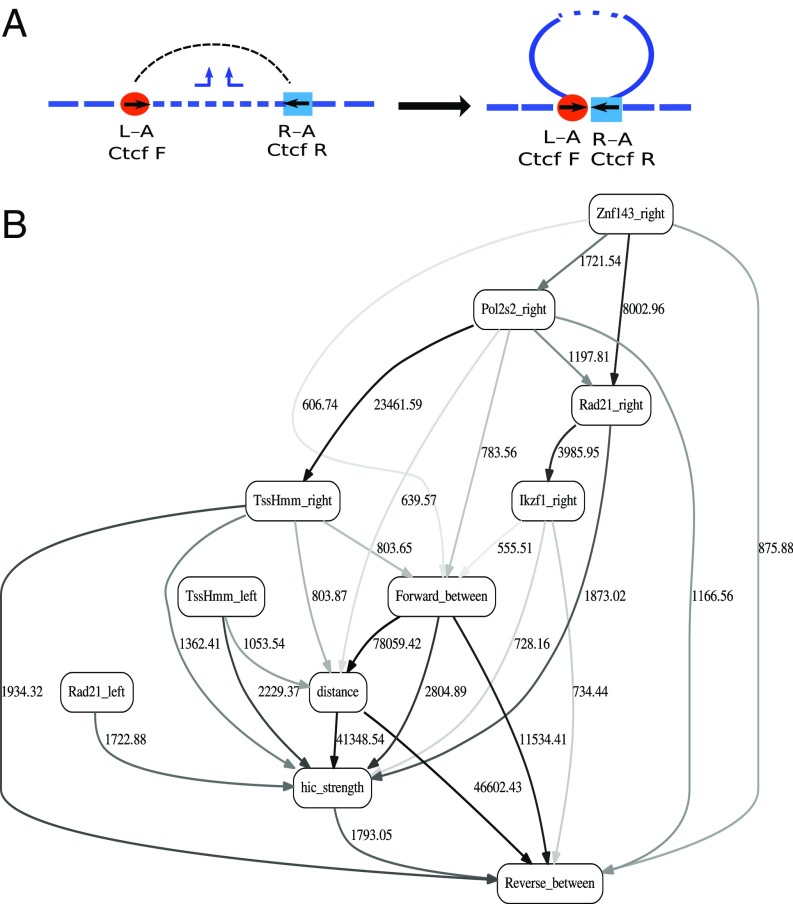
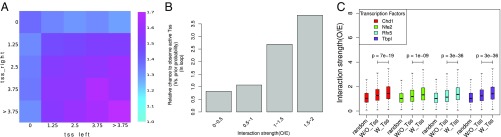
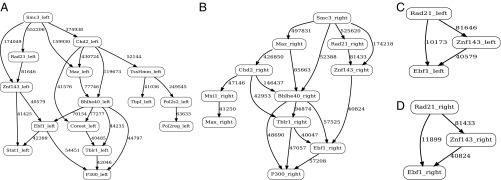
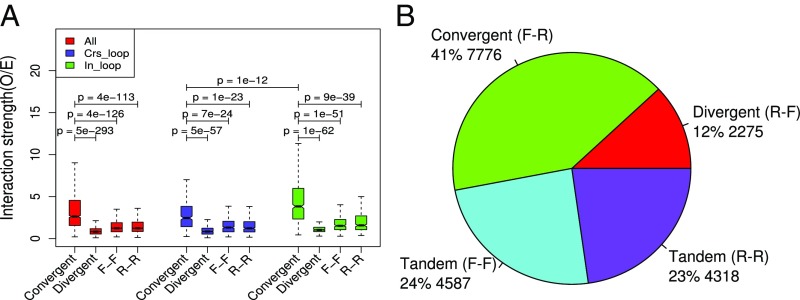
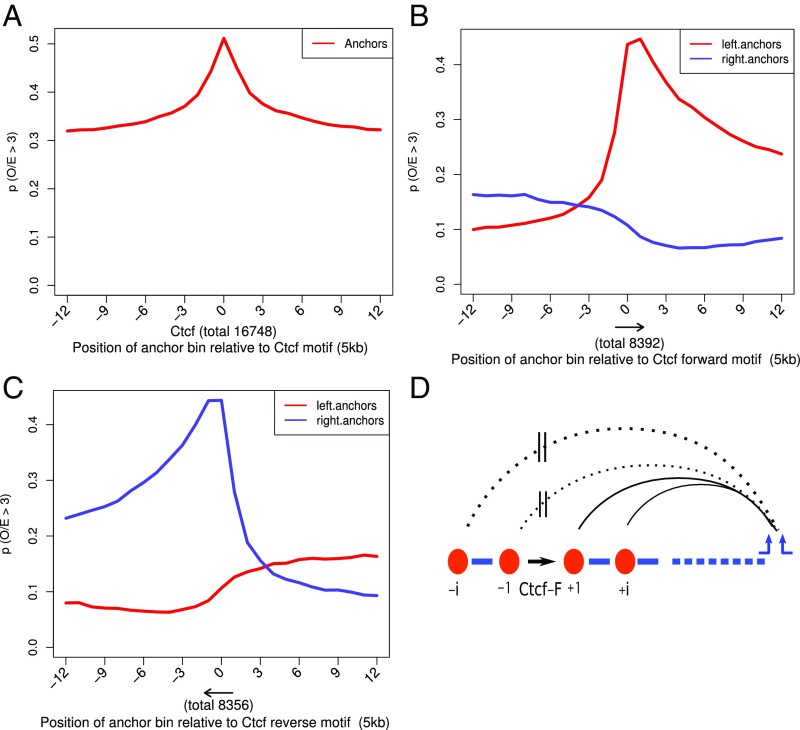
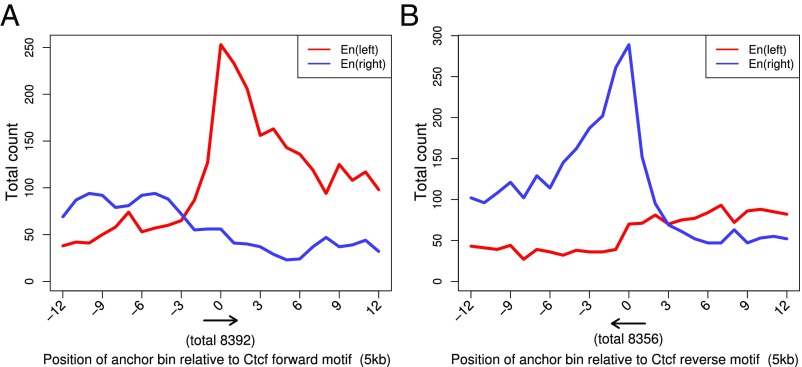
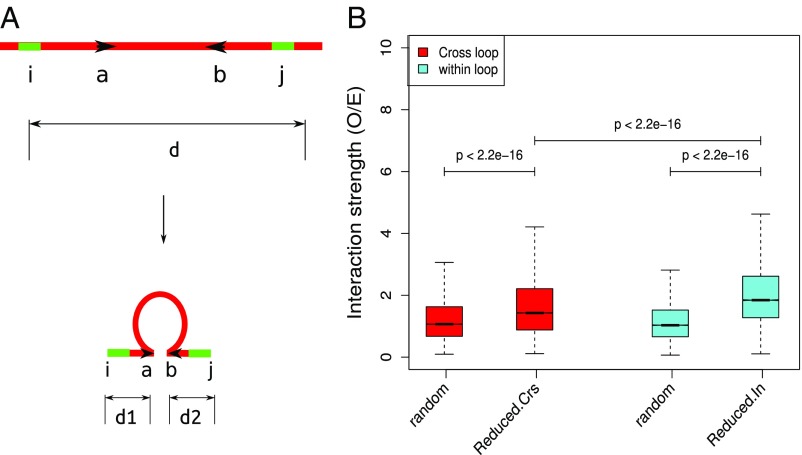
Long-range intrachromosomal interactions play an important role in 3D chromosome structure and function, but our understanding of how various factors contribute to the strength of these interactions remains poor. In this study we used a recently developed analysis framework for Bayesian network (BN) modeling to analyze publicly available datasets for intrachromosomal interactions. We investigated how 106 variables affect the pairwise interactions of over 10 million 5-kb DNA segments in the B-lymphocyte cell line GB12878. Strictly data-driven BN modeling indicates that the strength of intrachromosomal interactions (hic_strength) is directly influenced by only four types of factors: distance between segments, Rad21 or SMC3 (cohesin components),transcription at transcription start sites (TSS), and the number of CCCTC-binding factor (CTCF)-cohesin complexes between the interacting DNA segments. Subsequent studies confirmed that most high-intensity interactions have a CTCF-cohesin complex in at least one of the interacting segments. However, 46% have CTCF on only one side, and 32% are without CTCF. As expected, high-intensity interactions are strongly dependent on the orientation of the ctcf motif, and, moreover, we find that the interaction between enhancers and promoters is similarly dependent on ctcf motif orientation. Dependency relationships between transcription factors were also revealed, including known lineage-determining B-cell transcription factors (e.g., Ebf1) as well as potential novel relationships. Thus, BN analysis of large intrachromosomal interaction datasets is a useful tool for gaining insight into DNA-DNA, protein-DNA, and protein-protein interactions.

Keywords: DNA looping; DNA reeling; chromatin; enhancers.


Conflict of interest statement

The authors declare no conflict of interest.

Figures

Fig. 1.
Fig. 1.
(A) Loop formation due to DNA reeling. A DNA reeling machine binds between two CTCF–cohesin complexes and initiates DNA reeling. Reeling is stopped when an appropriately oriented CTCF–cohesin complex is reached. As a result of this process, two convergent CTCF–cohesin complexes are often pulled close to each other. Paired bent arrows represent a bidirectional reeling machine pulling in DNA from both sides. Red circle is left anchor (L-A) segment with an F ctcf motif. Blue square is a right anchor (R-A) segment containing an R-oriented ctcf motif. (B) BN analysis for chromosome 1. See Results for an introduction to BN analysis. Shown is the MN for the variable “hic_strength.” This is a part of the complete BN shown in SI Appendix, Fig. S1. This BN is derived from the chromosome 1 dataset containing interactions wherein both anchors are located within Hi-C loops. Nodes in the network correspond to the variables, and edges to the dependencies between the variables. Directionality of the edge (arrow) is for mathematical convenience only and does not imply causation. “Boldness” of the edge is proportional to the dependency strength, also indicated by the number shown next to the edge. See SI Appendix, section 5, Tables S1 and S2.
Fig. 2.
Fig. 2.
TSS activity affects interaction strength. (A) Heatmap showing that TSS activity within the two interacting anchors is positively associated with interaction strength. The color gradient represents the average interaction strength. Tss level is in units of rpkm. (B) Interaction strength affects the chance to observe Tss–Tss interactions. y axis represents the relative chance of observing the TSS activity (>5rpkm) at one anchor given the corresponding interaction strength (x axis) and Tss (>5rpkm) in the other anchor. (C) Interaction strength between two anchors with at least one occupied by a TF decreases if no TSS activity is associated with these anchors. W/O_Tss: without Tss. W_Tss: with Tss. P values were calculated by a Kolmogorov–Smirnov test. The “random” sample had a similar “distance” distribution to the target sample but was sampled randomly from the whole population.
Fig. 3.
Fig. 3.
MNs of Ebf1 variable node, separated into left and right anchors. (A) Extended MN of the Ebf1 left variable in the BN derived from the chr1 unrestricted dataset. (B) Same as in A, for Ebf1 right. (C) Visualization of a trivariate interaction between Ebf1, Rad21, and Znf143 variables, left anchor. (D) Same as in C, right anchor. See Fig. 1B and SI Appendix, section 5, Tables S1 and S2 for general BN designations and principal variable descriptions. Note that dependency strength is shown as a number (proportional to the likelihood ratio, see text for details) next to the corresponding edge in the network. Only edges above 40,000 in strength are shown in Fig. 3 C and D for easier network readability.
Fig. 4.
Fig. 4.
Orientation of convergent CTCF–cohesin complexes affects interaction strength. F: The CTCF–cohesion complex is in the forward orientation. R: The CTCF–cohesin complex is in the R orientation. (A) Convergent CTCF–cohesin pairs (F_R) interact more strongly compared with the other orientations. In_loop: The two anchors (containing CTCF–cohesin complexes) of an interaction are in the same loop. Crs_loop: The two anchors cross the loop boundaries. (B) Genome-wide, convergent CTCF–cohesin complex pairs that are within loops (8) are more frequent than the other orientation combinations. Overall, if Hi-C loops are not selected, the four categories of ctcf pairs occur in about equal numbers: F–R, 23,836, 24%; R–F, 25,935, 26%; F–F, 24,709, 25%; R–R, 24,283, 25%.
Fig. 5.
Fig. 5.
CTCF–cohesin complexes affect the distribution and direction of high-intensity intrachromosomal interactions. (A)The probability profile for 5-kb segments neighboring CTCF–cohesin complexes containing the anchors of high-intensity interactions. The y axis has the same meaning in A–C. (B) The probability profile for 5-kb segments neighboring the CTCF–cohesin complexes with F motifs containing the left or right anchors of a high-intensity interaction. (C)The probability profile for 5-kb segments neighboring the CTCF–cohesin complexes with R motifs containing the left or right anchors of a high-intensity interaction. (D) The formation of an asymmetrical distribution in B can be explained by a DNA-reeling/extrusion model. In this model, reeling and loop formation initiated downstream will be terminated by an F CTCF–cohesin complex.
Fig. 6.
Fig. 6.
CTCF–cohesin complexes affect EP interactions. (A) The genome-wide occurrence of upstream enhancers (En left) and downstream enhancers (En right) within the 5-kb segments neighboring CTCF–cohesin complexes with F motifs. (B) The Same as in A but with the R CTCF–cohesin complex. Note that upstream and downstream follow the standard chromosomal base-numbering convention relative to the interacting promoters, not related to the transcription direction. A similar finding is obtained by targeting the high-intensity interactions crossing loop boundaries (SI Appendix, section 3 and Fig. S3 A–C).
Fig. 7.
Fig. 7.
Convergent CTCF–cohesin complex pairs affect interaction strength via a “reduced distance” (RD) effect. (A) An example to show the principle of RD. The genomic anchors i and j are separated by a pair of CTCF–cohesin complexes with convergent direction. If the loop is formed between a and b, the distance between i and j changes from d to d1 + d2. (The calculation of the RD is shown in detail in SI Appendix, section 4). (B) The interactions that are affected by the RD have higher interaction strength than average.

Similar articles

Cited by

References

    1. Dekker J, Marti-Renom MA, Mirny LA. Exploring the three-dimensional organization of genomes: Interpreting chromatin interaction data. Nat Rev Genet. 2013;14:390–403. - PMC - PubMed
    1. Deng W, et al. Controlling long-range genomic interactions at a native locus by targeted tethering of a looping factor. Cell. 2012;149:1233–1244. - PMC - PubMed
    1. Shi J, et al. Role of SWI/SNF in acute leukemia maintenance and enhancer-mediated Myc regulation. Genes Dev. 2013;27:2648–2662. - PMC - PubMed
    1. Levine M, Cattoglio C, Tjian R. Looping back to leap forward: Transcription enters a new era. Cell. 2014;157:13–25. - PMC - PubMed
    1. Dekker J, Rippe K, Dekker M, Kleckner N. Capturing chromosome conformation. Science. 2002;295:1306–1311. - PubMed

Publication types

MeSH terms

LinkOut - more resources