. 2017 Nov 28;114(48):12737-12742.
doi: 10.1073/pnas.1714074114. Epub 2017 Nov 13.

Correlating kinetic and structural data on ubiquinone binding and reduction by respiratory complex I

Affiliations

Correlating kinetic and structural data on ubiquinone binding and reduction by respiratory complex I

Justin G Fedor et al. Proc Natl Acad Sci U S A. .

Abstract

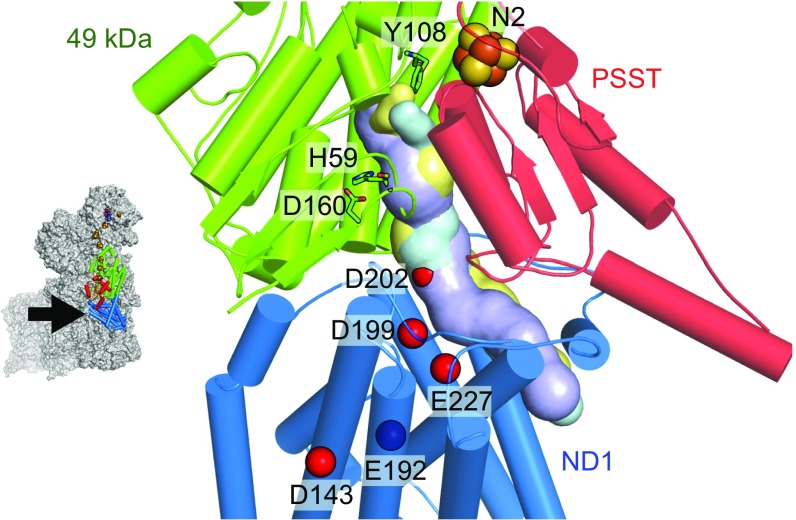
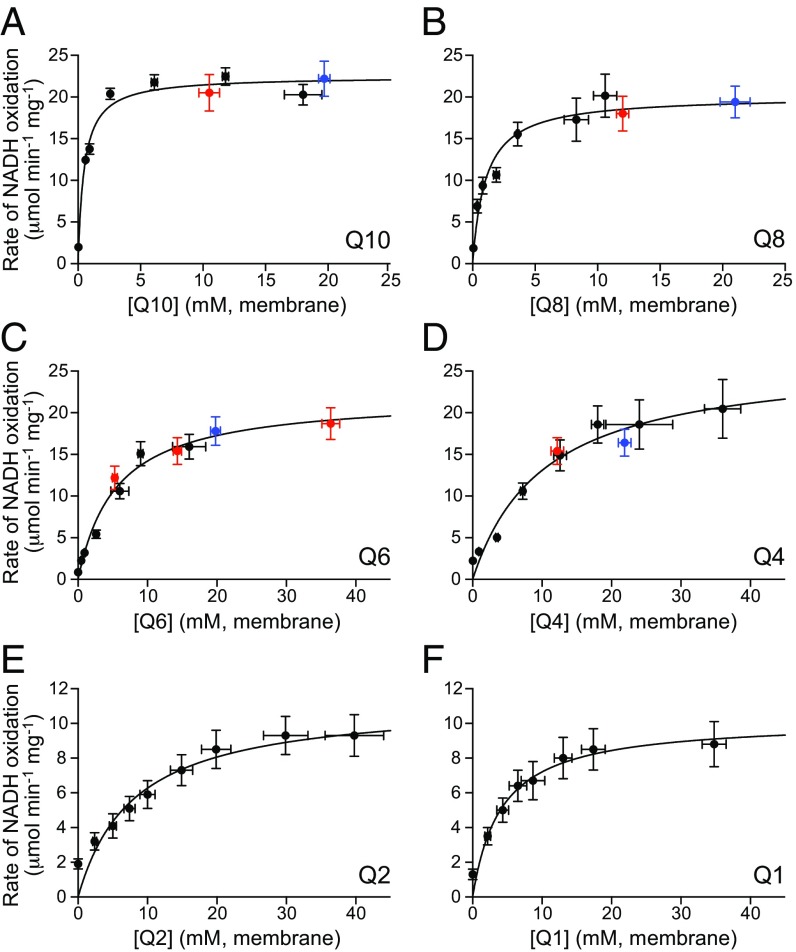
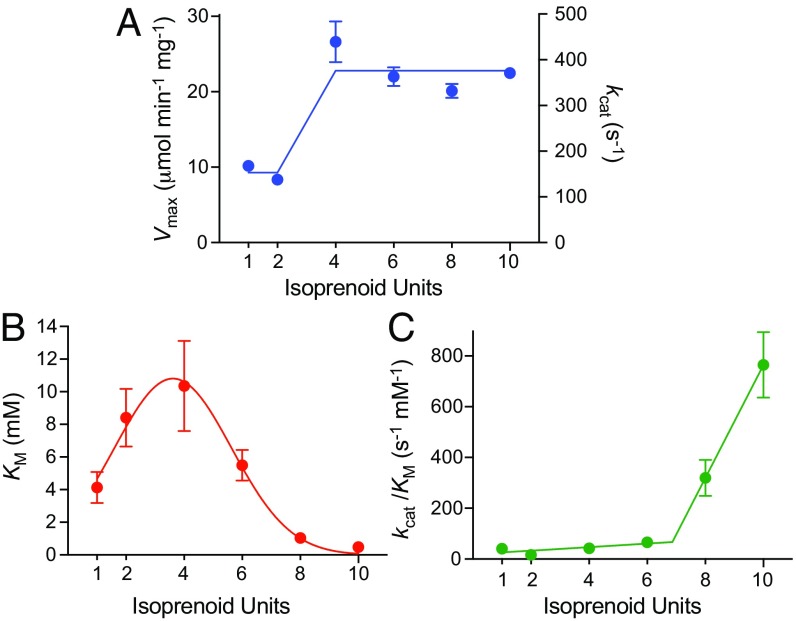
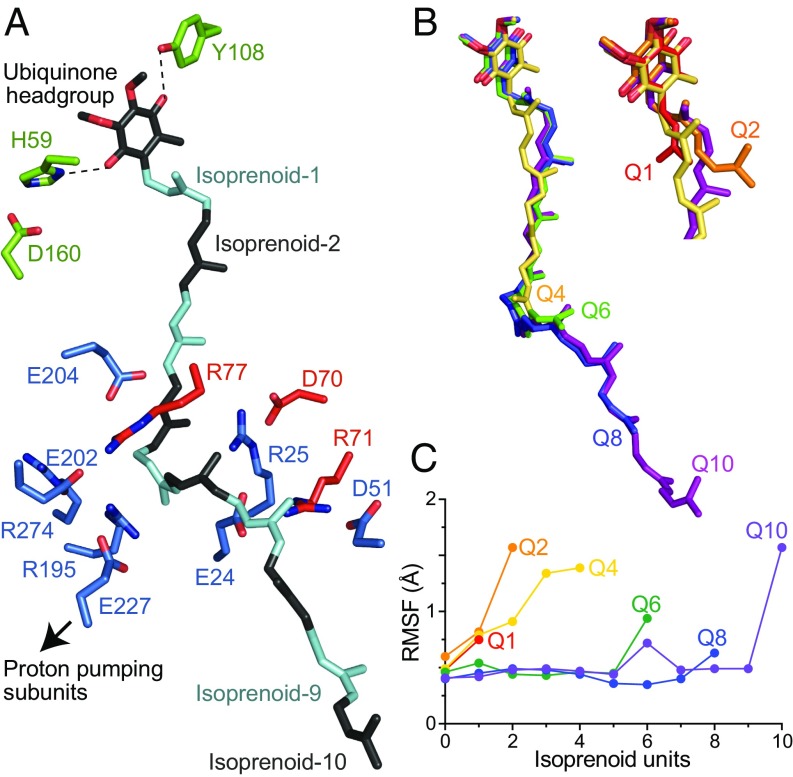
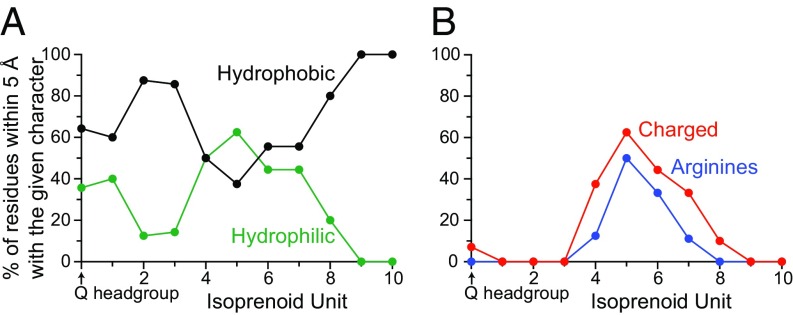
Respiratory complex I (NADH:ubiquinone oxidoreductase), one of the largest membrane-bound enzymes in mammalian cells, powers ATP synthesis by using the energy from electron transfer from NADH to ubiquinone-10 to drive protons across the energy-transducing mitochondrial inner membrane. Ubiquinone-10 is extremely hydrophobic, but in complex I the binding site for its redox-active quinone headgroup is ∼20 Å above the membrane surface. Structural data suggest it accesses the site by a narrow channel, long enough to accommodate almost all of its ∼50-Å isoprenoid chain. However, how ubiquinone/ubiquinol exchange occurs on catalytically relevant timescales, and whether binding/dissociation events are involved in coupling electron transfer to proton translocation, are unknown. Here, we use proteoliposomes containing complex I, together with a quinol oxidase, to determine the kinetics of complex I catalysis with ubiquinones of varying isoprenoid chain length, from 1 to 10 units. We interpret our results using structural data, which show the hydrophobic channel is interrupted by a highly charged region at isoprenoids 4-7. We demonstrate that ubiquinol-10 dissociation is not rate determining and deduce that ubiquinone-10 has both the highest binding affinity and the fastest binding rate. We propose that the charged region and chain directionality assist product dissociation, and that isoprenoid stepping ensures short transit times. These properties of the channel do not benefit the exhange of short-chain quinones, for which product dissociation may become rate limiting. Thus, we discuss how the long channel does not hinder catalysis under physiological conditions and the possible roles of ubiquinone/ubiquinol binding/dissociation in energy conversion.

Keywords: NADH:ubiquinone oxidoreductase; bioenergetics; coenzyme Q10; electron transport chain; mitochondria.


Conflict of interest statement

The authors declare no conflict of interest.

Figures

Fig. 1.
Fig. 1.
The proposed ubiquinone-binding channel in mammalian complex I. The 49-kDa, PSST, and ND1 subunits from bovine complex I (5LC5.pdb) (6) are in cartoon, with the surfaces of predicted quinone-binding cavities in the aligned structures of the bovine (6) (cyan), porcine (7) (yellow), and T. thermophilus (10) (purple) enzymes. The quinone headgroup is considered to hydrogen bond to Y108 and H59, and H59 to D160. The carboxylate groups of acidic residues connecting the quinone-binding region to the proton-pumping subunits are shown by red spheres. Cavities were generated using the Caver 3.0 PyMOL plugin (33) with a 1.4-Å probe.
Fig. 2.
Fig. 2.
Complex I is rate limiting for catalysis in CI-AOX PLs. Normalized rates of the NADH:O2 reaction by PLs containing high (1:51, blue) and low (1:1.5, red) ratios of oriented-CI:AOX are shown. Both preparations contained ∼10 mM Q10. (A) Inhibition by piericidin A. (B) Inhibition by colletochlorin B.
Fig. 3.
Fig. 3.
Michaelis–Menten curves for reduction of Q1–Q10 by complex I. (A) Q10, (B) Q8, (C) Q6, (D) Q4, (E) Q2, and (F) Q1. The black points are from sets of PLs with different quinone concentrations; the datasets for Q1–Q8 were adjusted to the Q10 dataset using the red and blue datasets and scaling factors of 1.44 (Q8), 1.35 (Q6), 1.86 (Q4), 1.57 (red points), and 1.60 (blue points). Each value is the mean of at least three replicates ± the SD propagated from each underlying measurement.
Fig. 4.
Fig. 4.
Dependence of the Michaelis–Menten parameters on isoprenoid chain length. (A) Vmax and kcat values shown with average values of 9.3 ± 0.9 µmol⋅min−1⋅mg−1 (150 ± 15 s−1) for Q1–Q2 and 23 ± 2 µmol⋅min−1⋅mg−1 (380 ± 39 s−1) for Q4–Q10. (B) KM values; the curve is only to guide the eye. (C) kcat/KM values with two linear fits (gradients 7.0 and 220 mM−1⋅s−1⋅isoprenoid unit−1). Values are from the data in Fig. 3 and also given in Table S1.
Fig. 5.
Fig. 5.
Modeled structures of bovine complex I with Q1–Q10 bound. (A) The modeled Q10 molecule with its isoprenoids in black and cyan, alternately, alongside the sidechains of charged residues within 5 Å (red, PSST; blue, ND1). Green: 49-kDa subunit residues hydrogen bonded to the ubiquinone headgroup. (B) The overlaid modeled structures for Q10, Q8, Q6, and Q4, and Inset for Q10, Q4, Q2, and Q1. (C) RMSFs for each quinone species from MD simulations, colored as in B.
Fig. 6.
Fig. 6.
The protein environment of the modeled bound Q10 molecule in the structure of bovine CI. (A) Percentage of residues within 5 Å of each isoprenoid that are hydrophobic (A, F, I, L, M, P, V, W, and Y) or hydrophilic (C, D, E, G, H, K, N, Q, R, S, and T). (B) Percentage of residues within 5 Å of each isoprenoid that are canonically charged (D, E, H, K, and R) and that are arginines.

References

    1. Hirst J. Mitochondrial complex I. Annu Rev Biochem. 2013;82:551–575. - PubMed
    1. Jones AJY, Blaza JN, Varghese F, Hirst J. Respiratory complex I in Bos taurus and Paracoccus denitrificans pumps four protons across the membrane for every NADH oxidized. J Biol Chem. 2017;292:4987–4995. - PMC - PubMed
    1. Galkin AS, Grivennikova VG, Vinogradov AD. →H+/2e- stoichiometry in NADH-quinone reductase reactions catalyzed by bovine heart submitochondrial particles. FEBS Lett. 1999;451:157–161. - PubMed
    1. Murphy MP. How mitochondria produce reactive oxygen species. Biochem J. 2009;417:1–13. - PMC - PubMed
    1. Fassone E, Rahman S. Complex I deficiency: Clinical features, biochemistry and molecular genetics. J Med Genet. 2012;49:578–590. - PubMed

Publication types

MeSH terms

LinkOut - more resources