

Nutritional and greenhouse gas impacts of removing animals from US agriculture
- PMID: 29133422
- PMCID: PMC5715743
- DOI: 10.1073/pnas.1707322114
Nutritional and greenhouse gas impacts of removing animals from US agriculture
Abstract
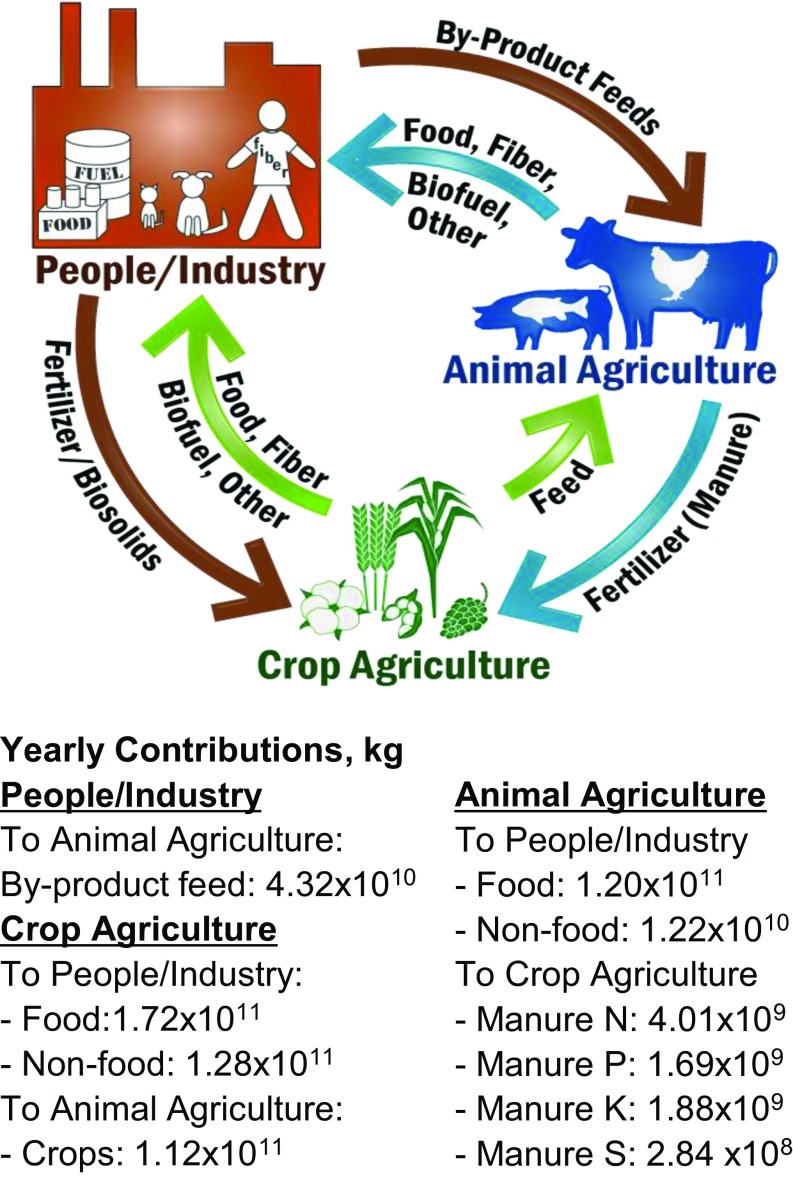
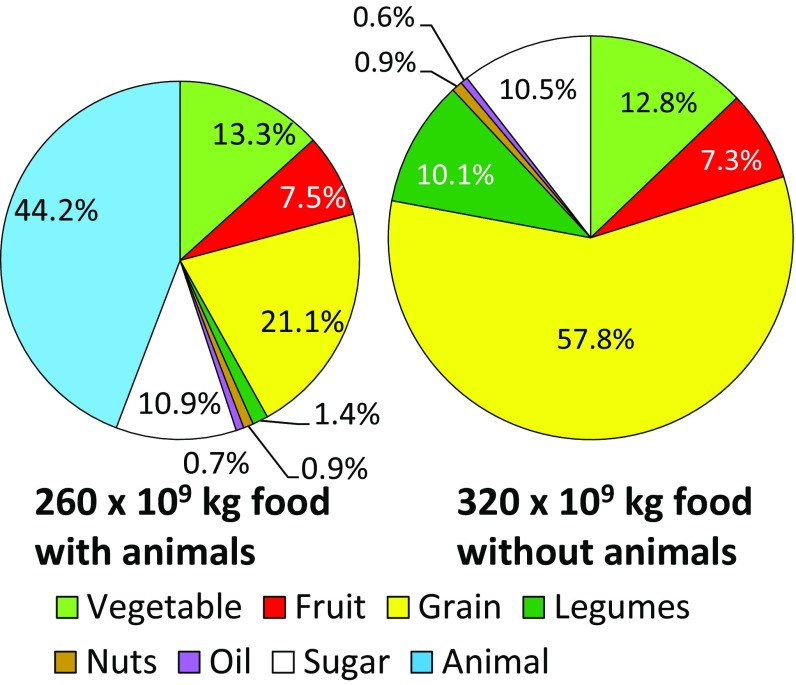
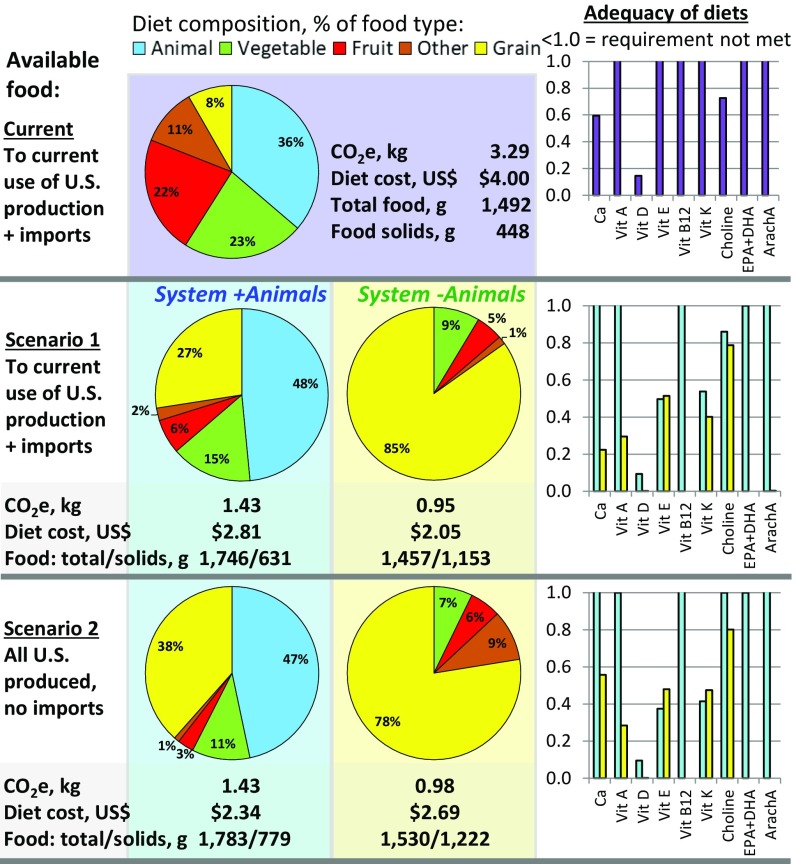
As a major contributor to agricultural greenhouse gas (GHG) emissions, it has been suggested that reducing animal agriculture or consumption of animal-derived foods may reduce GHGs and enhance food security. Because the total removal of animals provides the extreme boundary to potential mitigation options and requires the fewest assumptions to model, the yearly nutritional and GHG impacts of eliminating animals from US agriculture were quantified. Animal-derived foods currently provide energy (24% of total), protein (48%), essential fatty acids (23-100%), and essential amino acids (34-67%) available for human consumption in the United States. The US livestock industry employs 1.6 × 10⁶ people and accounts for $31.8 billion in exports. Livestock recycle more than 43.2 × 10⁹ kg of human-inedible food and fiber processing byproducts, converting them into human-edible food, pet food, industrial products, and 4 × 10⁹ kg of N fertilizer. Although modeled plants-only agriculture produced 23% more food, it met fewer of the US population's requirements for essential nutrients. When nutritional adequacy was evaluated by using least-cost diets produced from foods available, more nutrient deficiencies, a greater excess of energy, and a need to consume a greater amount of food solids were encountered in plants-only diets. In the simulated system with no animals, estimated agricultural GHG decreased (28%), but did not fully counterbalance the animal contribution of GHG (49% in this model). This assessment suggests that removing animals from US agriculture would reduce agricultural GHG emissions, but would also create a food supply incapable of supporting the US population's nutritional requirements.
Keywords: agriculture; food; food security; greenhouse gases; livestock.
Copyright © 2017 the Author(s). Published by PNAS.
Conflict of interest statement
The authors declare no conflict of interest.
Figures


Comment in
-
Reply to Van Meerbeek and Svenning, Emery, and Springmann et al.: Clarifying assumptions and objectives in evaluating effects of food system shifts on human diets.Proc Natl Acad Sci U S A. 2018 Feb 20;115(8):E1706-E1708. doi: 10.1073/pnas.1720895115. Epub 2018 Feb 12. Proc Natl Acad Sci U S A. 2018. PMID: 29440443 Free PMC article. No abstract available.
-
Causing confusion in the debate about the transition toward a more plant-based diet.Proc Natl Acad Sci U S A. 2018 Feb 20;115(8):E1701-E1702. doi: 10.1073/pnas.1720738115. Epub 2018 Feb 12. Proc Natl Acad Sci U S A. 2018. PMID: 29440444 Free PMC article. No abstract available.
-
Feedlot diet for Americans that results from a misspecified optimization algorithm.Proc Natl Acad Sci U S A. 2018 Feb 20;115(8):E1704-E1705. doi: 10.1073/pnas.1721335115. Epub 2018 Feb 12. Proc Natl Acad Sci U S A. 2018. PMID: 29440445 Free PMC article. No abstract available.
-
Without animals, US farmers would reduce feed crop production.Proc Natl Acad Sci U S A. 2018 Feb 20;115(8):E1703. doi: 10.1073/pnas.1720760115. Epub 2018 Feb 12. Proc Natl Acad Sci U S A. 2018. PMID: 29440446 Free PMC article. No abstract available.
References
-
- Food and Agriculture Organization of the United Nations . Livestock’s Long Shadow: Environmental Issues and Options. FAO; Rome: 2006.
-
- U.S. Department of Health and Human Services and U.S Department of Agriculture (2015) 2015–2020 Dietary Guidelines for Americans, 8th Edition. Available at http://health.gov/dietaryguidelines/2015/guidelines/. Accessed October 6, 2014. - PubMed
-
- Reijnders L, Soret S. Quantification of the environmental impact of different dietary protein choices. Am J Clin Nutr. 2003;78(suppl):664S–668S. - PubMed
-
- Baroni L, Cenci L, Tettamanti M, Berati M. Evaluating the environmental impact of various dietary patterns combined with different food production systems. Eur J Clin Nutr. 2007;61:279–286. - PubMed
-
- Baldwin RL, Bywater AC. Nutritional energetics of animals. Annu Rev Nutr. 1984;4:101–114. - PubMed
Publication types
MeSH terms
Substances
LinkOut - more resources
Full Text Sources
Other Literature Sources
Research Materials
Miscellaneous
