. 2018 Jan 16;38(3):e00427-17.
doi: 10.1128/MCB.00427-17. Print 2018 Feb 1.

Elevated HuR in Pancreas Promotes a Pancreatitis-Like Inflammatory Microenvironment That Facilitates Tumor Development

Affiliations

Elevated HuR in Pancreas Promotes a Pancreatitis-Like Inflammatory Microenvironment That Facilitates Tumor Development

Weidan Peng et al. Mol Cell Biol. .

Abstract

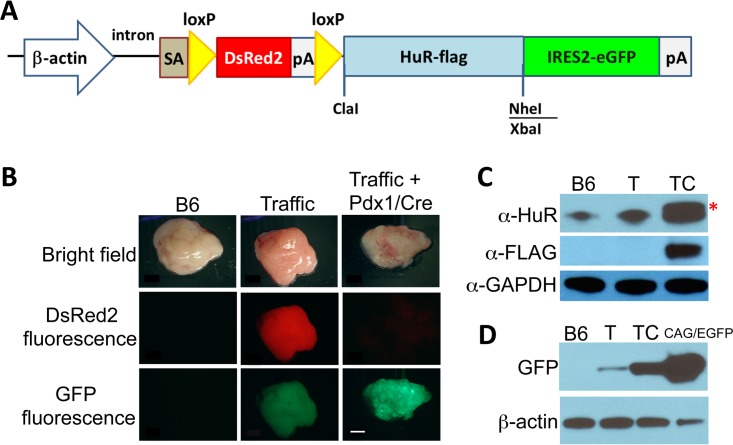
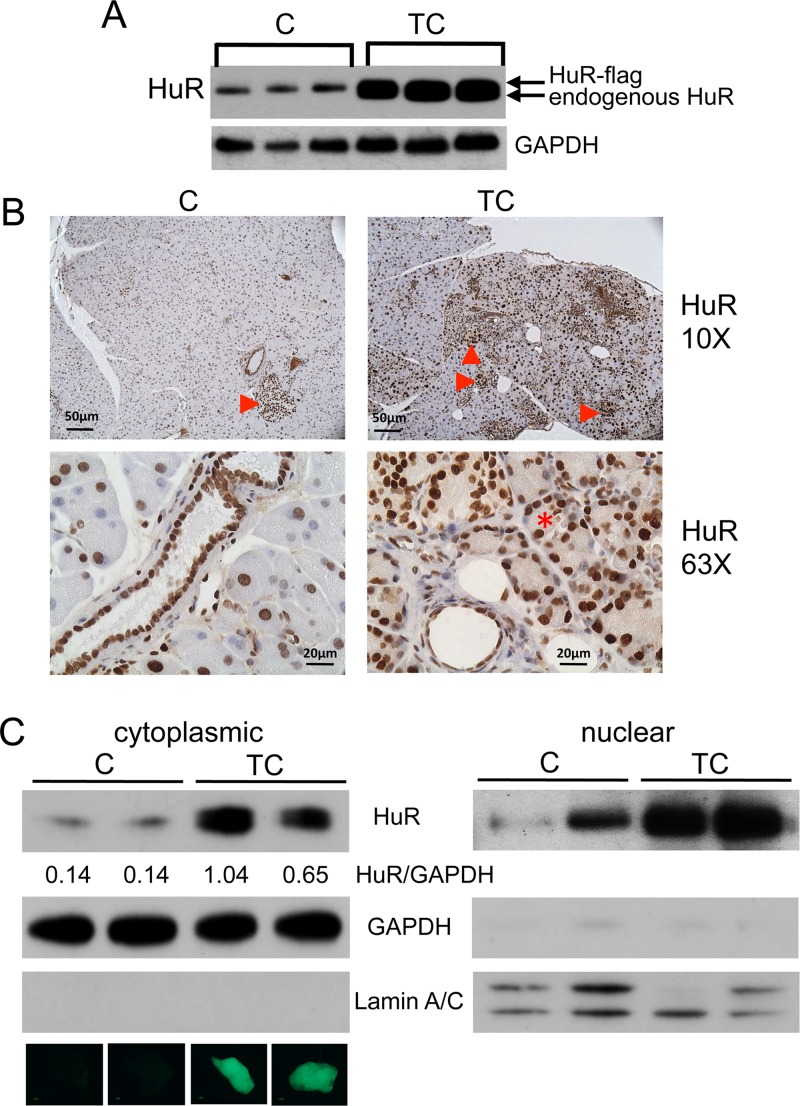
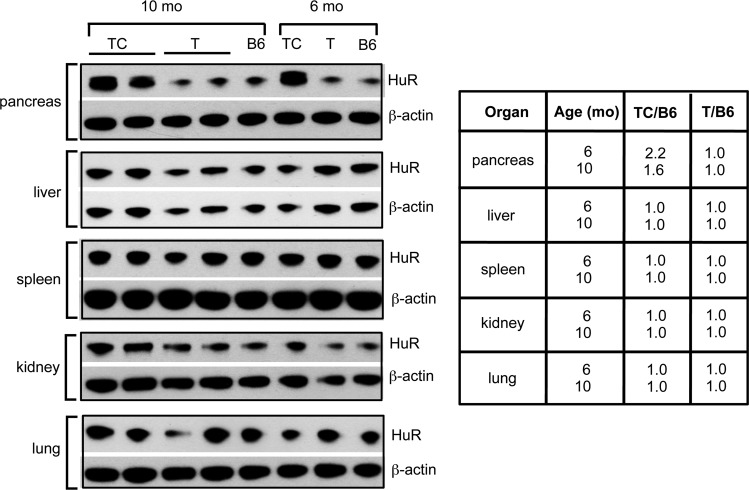
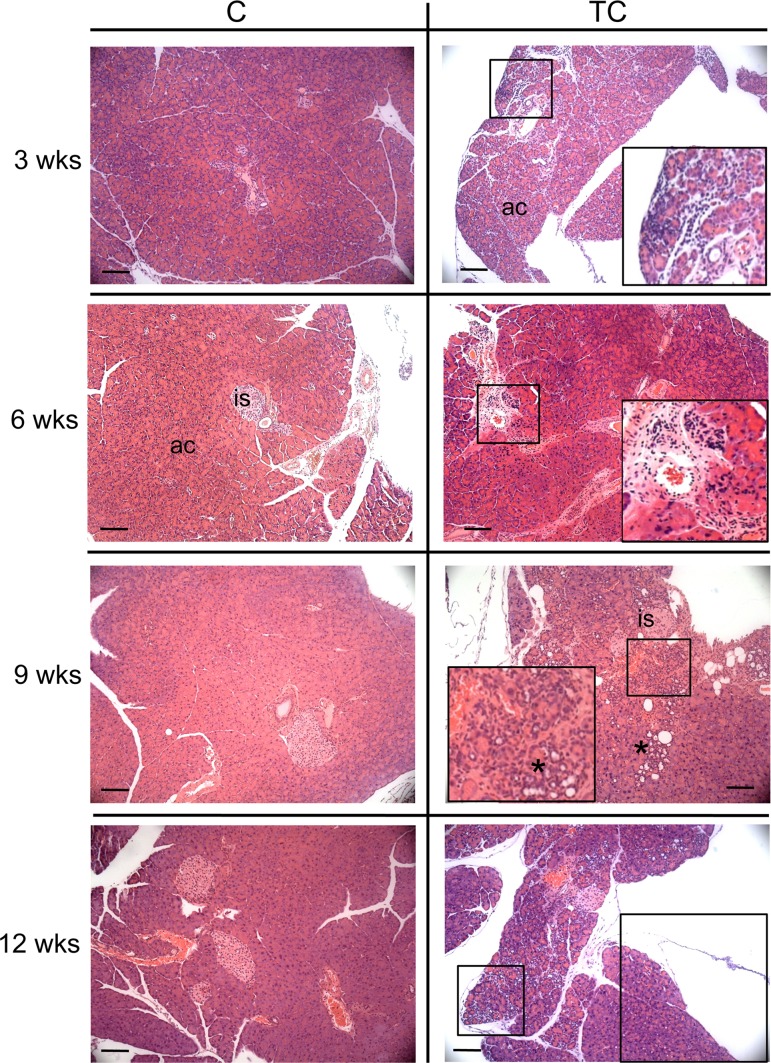
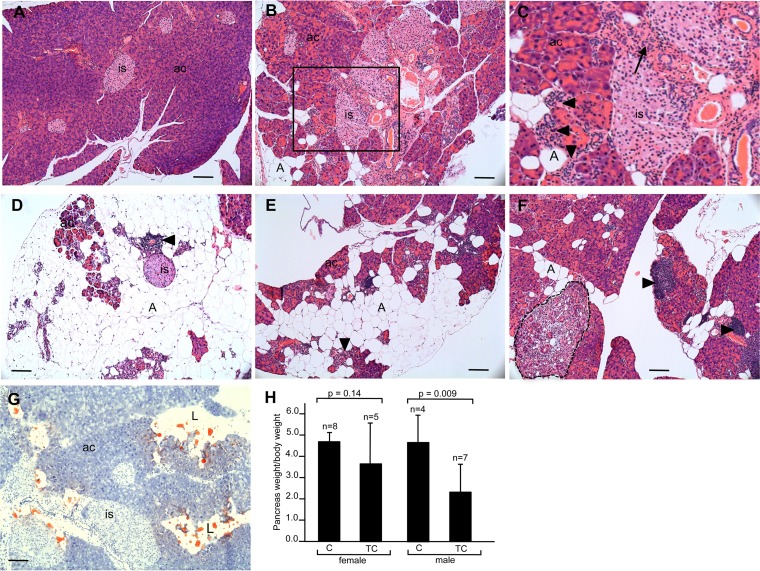
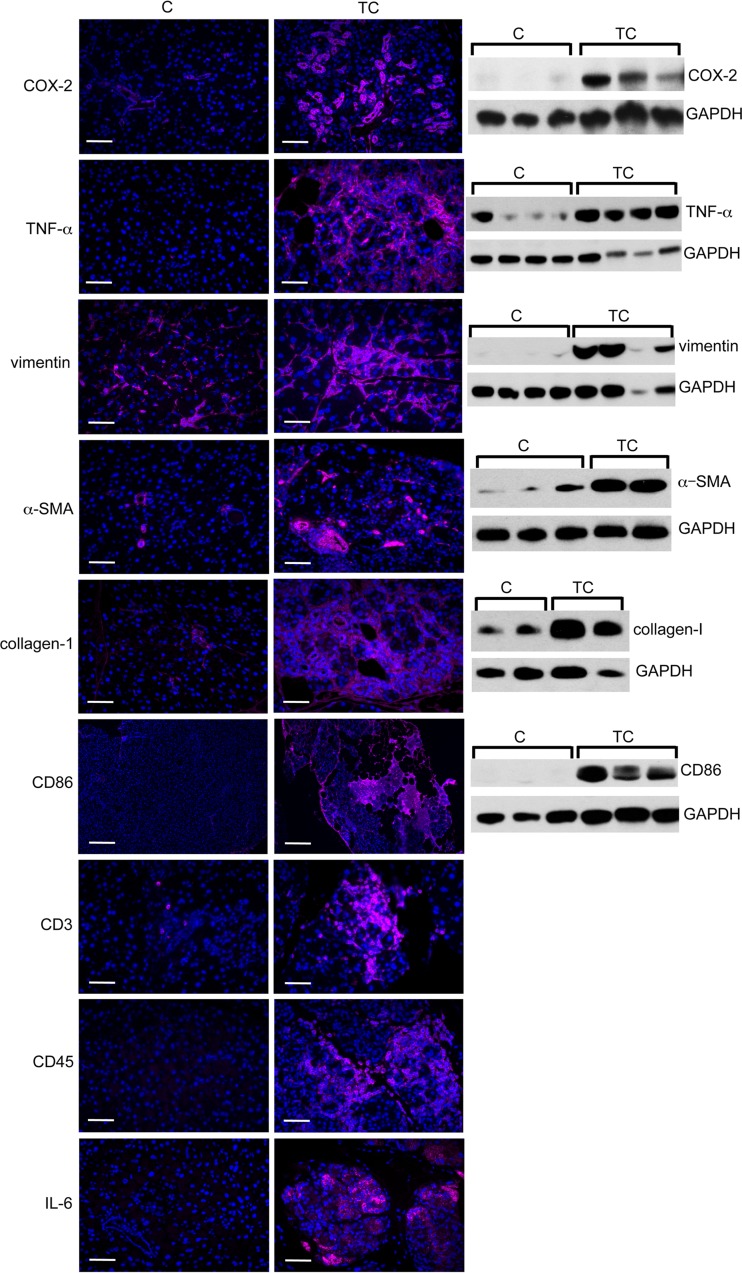
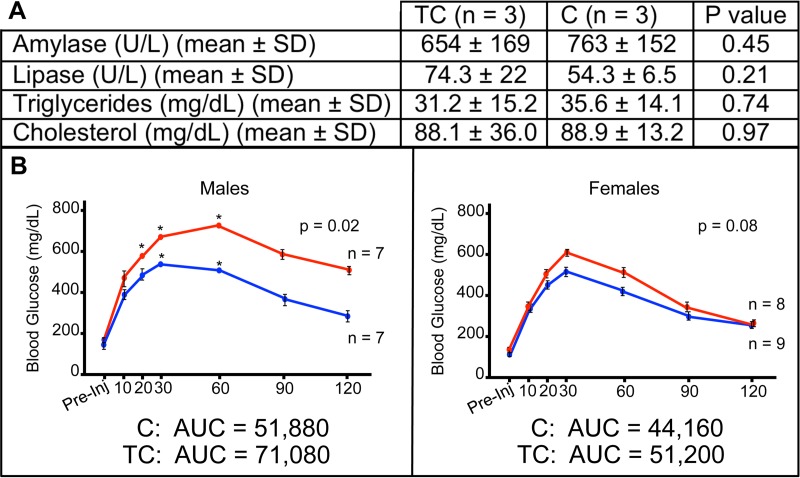
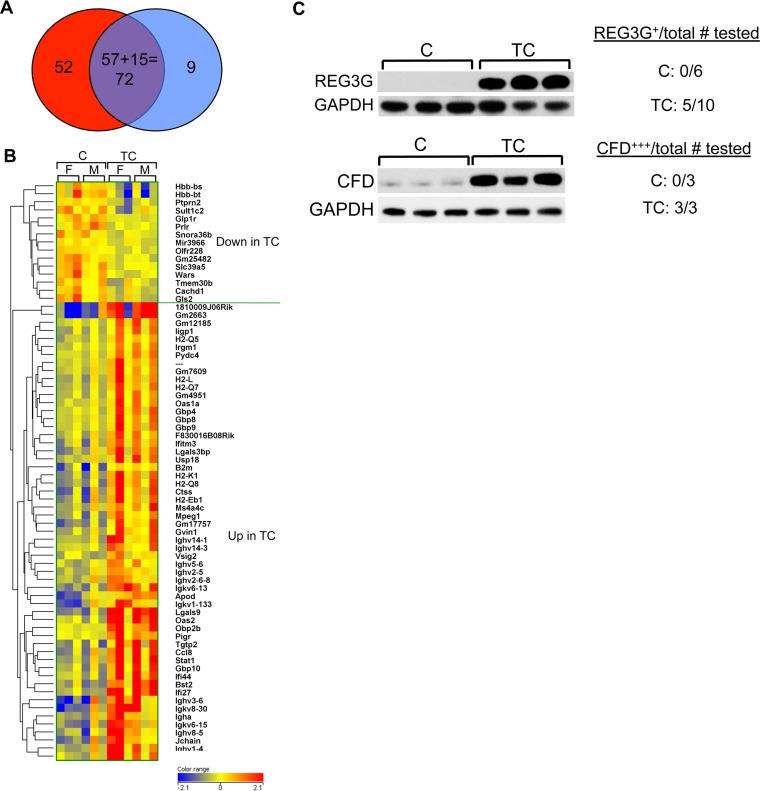
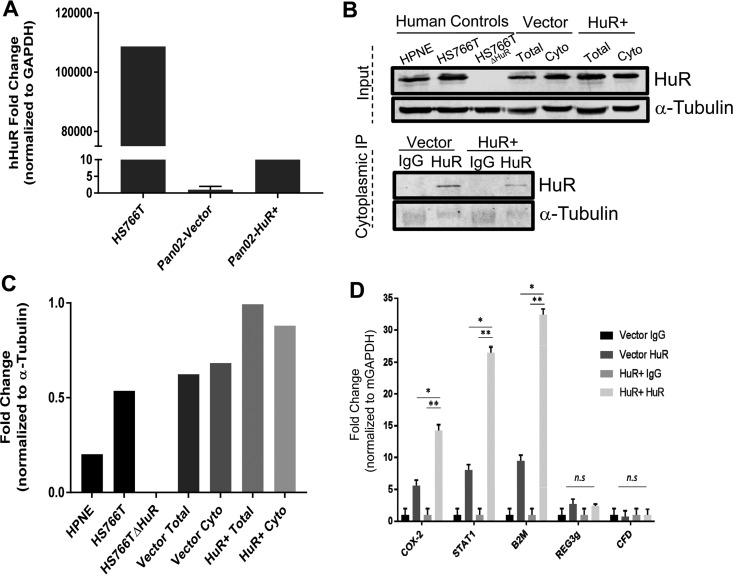
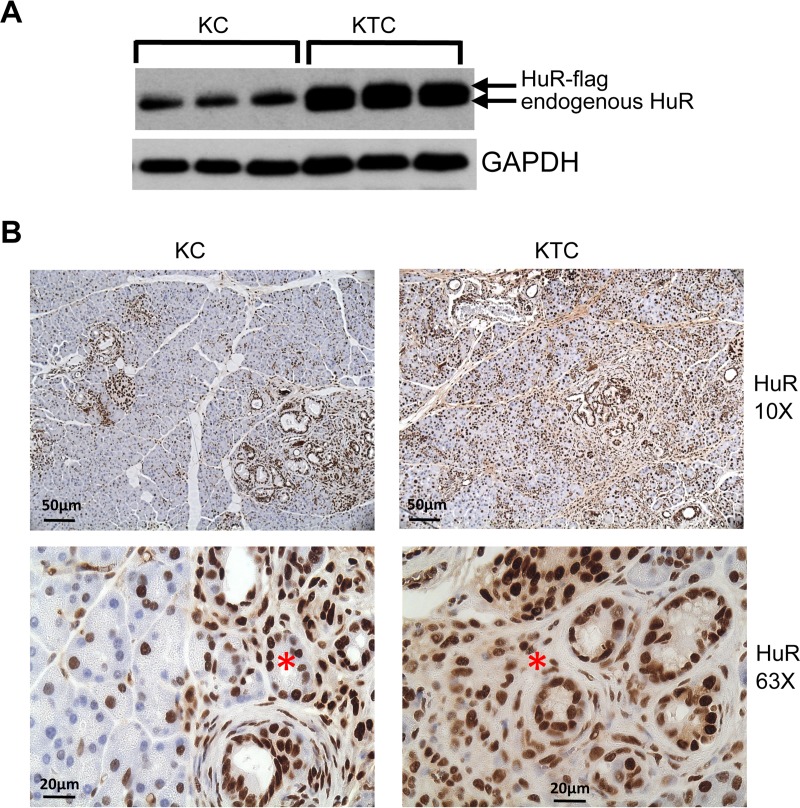
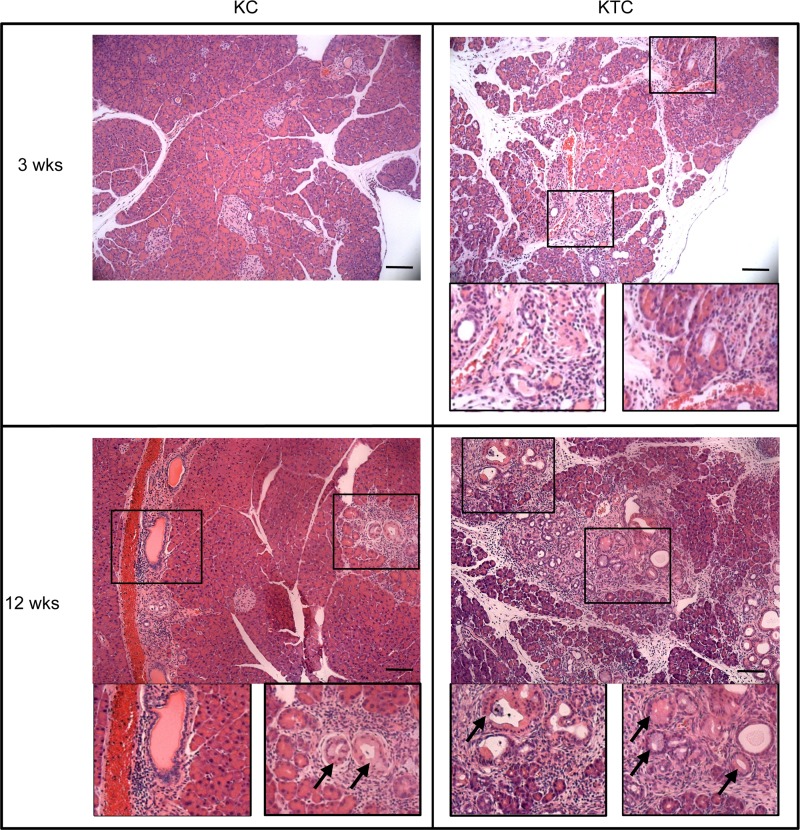
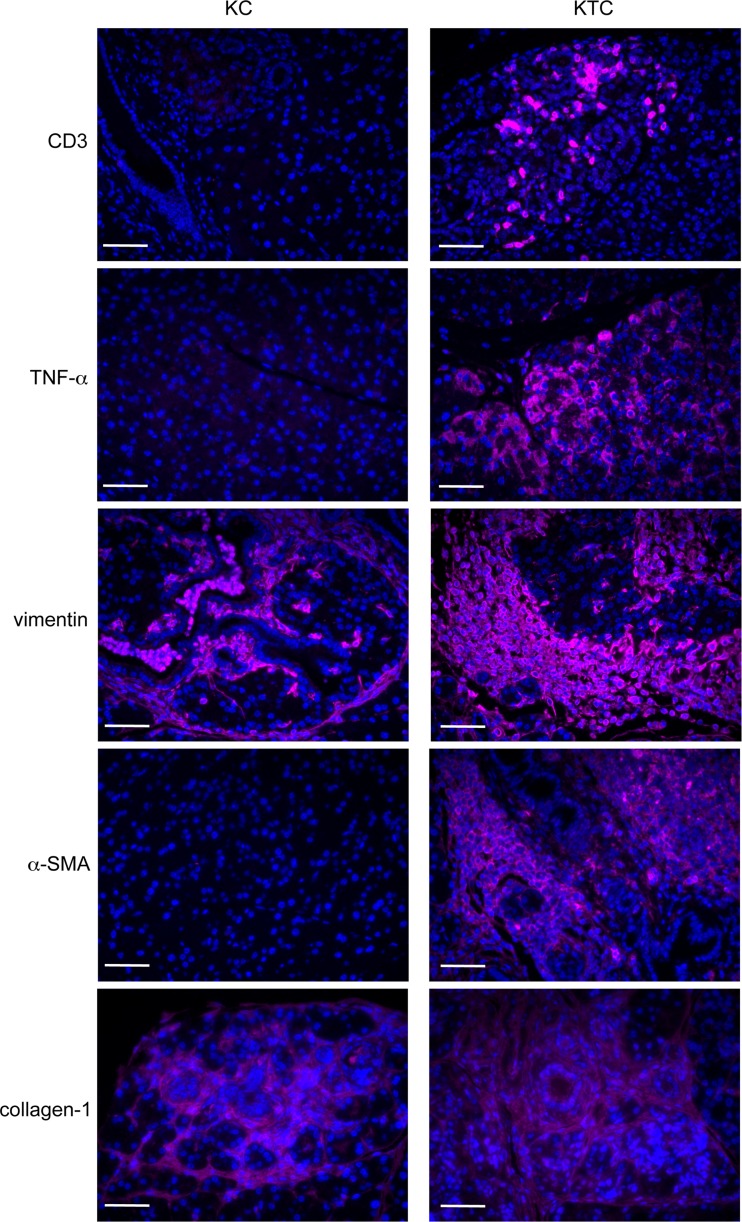
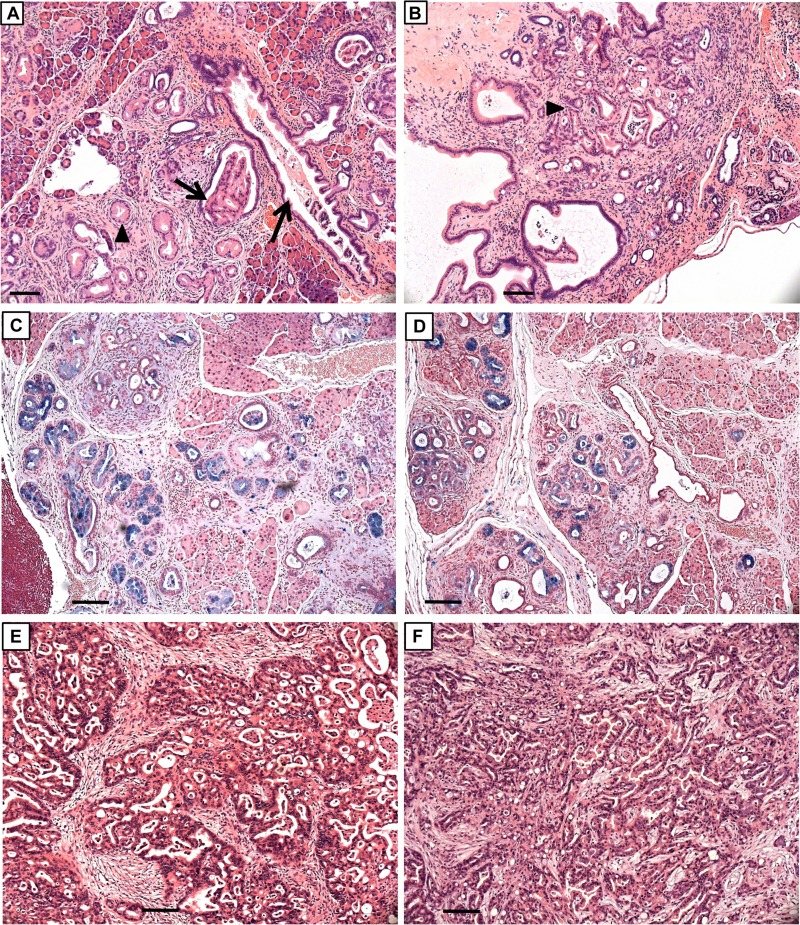
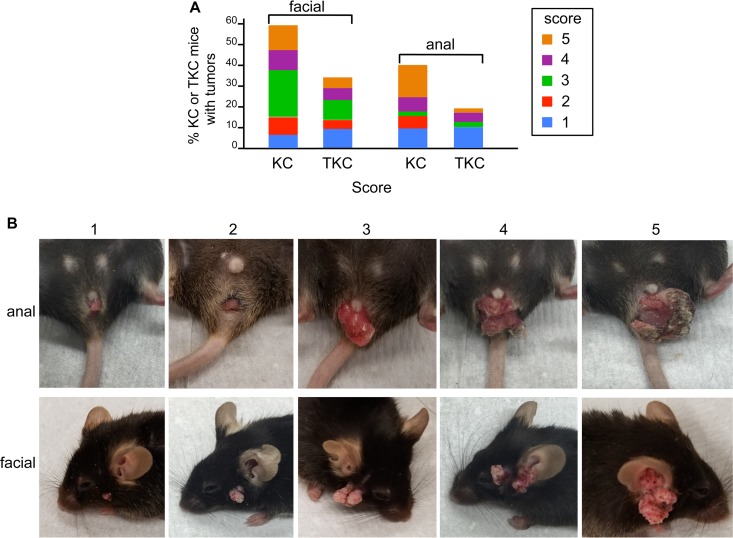
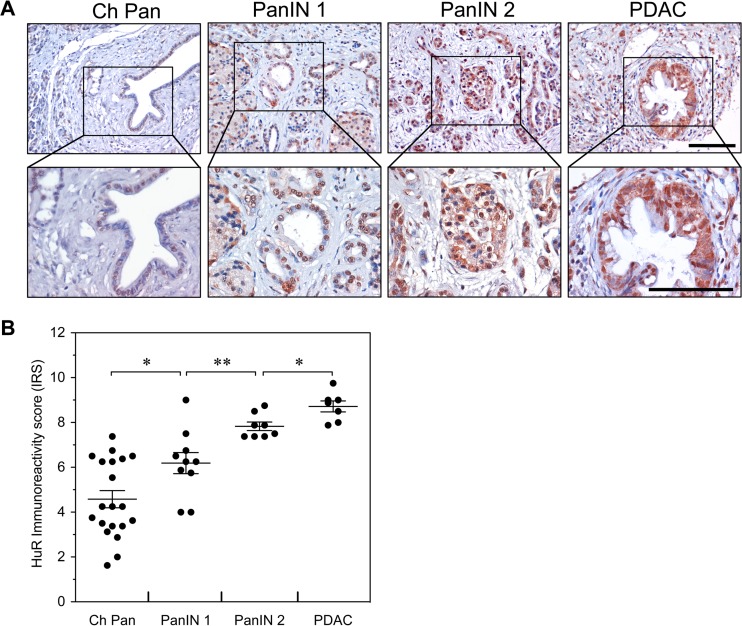
Human antigen R (ELAVL1; HuR) is perhaps the best-characterized RNA-binding protein. Through its overexpression in various tumor types, HuR promotes posttranscriptional regulation of target genes in multiple core signaling pathways associated with tumor progression. The role of HuR overexpression in pancreatic tumorigenesis is unknown and led us to explore the consequences of HuR overexpression using a novel transgenic mouse model that has a >2-fold elevation of pancreatic HuR expression. Histologically, HuR-overexpressing pancreas displays a fibroinflammatory response and other pathological features characteristic of chronic pancreatitis. This pathology is reflected in changes in the pancreatic gene expression profile due, in part, to genes whose expression changes as a consequence of direct binding of their respective mRNAs to HuR. Older mice develop pancreatic steatosis and severe glucose intolerance. Elevated HuR cooperated with mutant K-rasG12D to result in a 3.4-fold increase in pancreatic ductal adenocarcinoma (PDAC) incidence compared to PDAC presence in K-rasG12D alone. These findings implicate HuR as a facilitator of pancreatic tumorigenesis, especially in the setting of inflammation, and a novel therapeutic target for pancreatitis treatment.

Keywords: HuR; cancer; inflammation; pancreas.


Figures

FIG 1
FIG 1
Traffic/HuR transgene structure and expression. (A) Diagram of Traffic/HuR transgene. (B) Pancreas of B6, Traffic/HuR only (T), and Traffic/HuR + Pdx1/Cre (TC) mice observed under bright light, red fluorescent protein filter, and GFP filter. Note low GFP expression in T mice. (C) Immunoblots of protein extracts of pancreas of B6, T, and TC pancreas. Asterisk indicates HuR-Flag protein. (D) Immunoblot showing GFP expression in TC pancreas and low GFP expression in T pancreas. CAG/EGFP plasmid DNA serves as a positive control for GFP. GAPDH and β-actin serve as gel loading controls. Scale bar, 2 mm.
FIG 2
FIG 2
Traffic/HuR transgene expression in pancreas and other organs. DsRed2 protein is expressed in multiple organs in T and TC mice (red fluorescence) but not in C mice. Elevated GFP expression is observed in large amounts only in the pancreas of TC mice (green fluorescence). Low background GFP fluorescence is also observed in T pancreas and TC bladder, while no GFP expression is detected in other organs. In each image, C is in the upper left, T is in the upper right, and TC is on the bottom. The scale bar, indicating 2 mm, is shown in the pancreas bright-field image and applies to all panels.
FIG 3
FIG 3
HuR expression in C and TC pancreas. (A) Immunoblot of protein extracts pancreas from C and TC mice. GAPDH serves as gel loading control. (B) Pancreas sections from C and TC pancreas immunostained for HuR. Arrowheads indicate large amounts of HuR in islet cells. Asterisk indicates cytoplasmic HuR in acinus cells in TC pancreas. (C) Immunoblots of cytoplasmic and nuclear protein lysates prepared from C and TC pancreas. Loading control GAPDH was used for quantitative comparison of HuR amounts in C and TC cytoplasmic lysates (values indicated beneath HuR panel). GAPDH and lamin A/C were used as markers for cytoplasmic and nuclear extract preparations, respectively. Whole-mount GFP fluorescent images of the pancreas from which each preparation was made are shown below the cytoplasmic lamin A/C panel.
FIG 4
FIG 4
Pancreas-specific overexpression of HuR. HuR immunoblots showing pancreas-specific expression of Traffic-HuR transgene in 6-mo- and 10-mo-old TC mice. Scanned blots show total HuR amount (endogenous plus HuR-Flag) is ∼2-fold larger in TC mice than in pancreas of B6 and T control mice; in other organs, the amount of HuR in TC pancreas is the same as that in control pancreata.
FIG 5
FIG 5
H&E-stained pancreas of C and TC mice at 3, 6, 9, and 12 weeks of age. Boxes show immune infiltrates in TC pancreas. An asterisk indicates ductal proliferation. is, islet of Langerhans; ac, acinar cells. Scale bars, 50 μm.
FIG 6
FIG 6
Histopathology and weight of pancreas of older C and TC mice. (A to F) H&E-stained pancreas sections of 8-month-old C mouse (A) and TC mice (B to F). Panel C is a higher magnification of the boxed area in panel B. Extreme acinus cell atrophy is seen in panel D. (G) Oil Red O-stained pancreas section from 8-month-old TC mouse. (H) Pancreas weight/body weight of C and TC male and female mice. is, islet of Langerhans; ac, acinar cells; A, adipocytes; L, lipid. Arrowheads indicate immune infiltrates. The arrow indicates area of fibrosis. The area circumscribed by the dotted line in panel F is a ductal proliferative complex. Scale bars, 50 μm.
FIG 7
FIG 7
Fibroinflammatory gene expression in HuR-overexpressing pancreas. Immunostaining and immunoblots of markers of inflammation (COX-2 and TNF-α), fibrosis (vimentin, α-SMA, and collagen 1), immune cells (CD86, CD3, and CD45), and IL-6 in pancreas of T and TC mice. GAPDH serves as a gel loading control. Scale bars, 50 μm.
FIG 8
FIG 8
Metabolic measurements in C and TC pancreas. (A) Levels of serum amylase, lipase, triglycerides, and cholesterol in TC and C mice. (B) Concentrations of blood glucose at various times following administration of glucose bolus to 8-month-old TC (red) and C (blue) male and female mice. Asterisks indicate time points at which the glucose concentration exceeded the range of the GTT assay.
FIG 9
FIG 9
Microarray analysis comparing gene expression in pancreata of TC and C mice. (A) Venn diagram. Of 124 genes having the largest fold difference in expression (100 increased in TC [red], 24 decreased [blue]), 72 genes also had the lowest P values (57 increased, 15 decreased). (B) Heat map indicating 57 genes with increased expression in TC and 15 genes with decreased expression. Pancreata of 3 females (F) and 3 males (M) for each genotype were analyzed. (C) Immunoblots of TC and C pancreas protein extracts probed for REG3g and CFD. GAPDH serves as gel loading control.
FIG 10
FIG 10
HuR RNP-IP assays of selected proinflammatory mRNAs. (A) qRT-PCR analysis of murine Pan02 cells transfected with a human HuR expression plasmid or empty vector using probes that detect human HuR. RNA extracted from human PDAC cell line Hs766T serves as positive control. (B) Validation of mRNP-IP performed with total and cytoplasmic fractions of Pan02 cells transfected with either HuR overexpression plasmid or vector control; α-tubulin was used as a loading control for the input and a negative control for the immunoprecipitation samples. Hs766T, Hs766TΔHuR (60), and a human normal pancreatic line, HPNE, serve as controls. (C) Quantification of total HuR protein relative to α-tubulin levels. (D) Relative binding of mRNA targets to HuR, normalized to respective IgG controls, determined by qRT-PCR using GAPDH mRNA as a loading control and Cox-2 as a positive control. *, P < 0.01; **, P < 0.001; n.s., not significant.
FIG 11
FIG 11
HuR expression in KC and KTC mice. (A) Immunoblot of protein extracts from pancreas from KC and KTC mice. GAPDH serves as gel loading control. (B) Pancreas sections from 9-week-old KC and KTC pancreas immunostained for HuR. Asterisks indicate cytoplasmic HuR in regions of ductal proliferation in KC and KTC pancreas.
FIG 12
FIG 12
H&E-stained sections of KC and KTC pancreas from 3-week- and 12-week-old mice. Examples of areas of immune infiltrates and ductal proliferation are enlarged in boxed images. Arrows indicate PanIN-1A lesions. Scale bars, 20 μm.
FIG 13
FIG 13
Fibroinflammatory gene expression in KC and KTC pancreata. Sections of pancreas of KC and KTC mice immunostained for markers of immune cells (CD3), inflammation (TNF-α), and fibrosis (vimentin, α-SMA, and collagen 1). Scale bars, 20 μm.
FIG 14
FIG 14
Histopathology and PDACs in KC and KTC pancreas. H&E-stained sections of 32-week-old (A and C) KC and (B and D) KTC pancreas. PanIN-1A (arrowheads) and PanIN-1B (arrows) lesions are present. Alcian blue staining in panels C and D highlights mucus-containing PanIN lesions. H&E-stained sections of well-differentiated PDACs in 44-week-old KC mouse (E) and 49-week-old KTC mouse (F). Note extensive fibrosis in tumors. Scale bars, 50 μm.
FIG 15
FIG 15
Anal and facial papillomas in KC and KTC mice. (A) Incidence of facial and anal tumors of various sizes in KC and TKC mice. (B) Images of anal and facial papillomas representative of the scoring system that was adopted to rate tumor size (1, smallest; 5, largest).
FIG 16
FIG 16
Expression of HuR in human PDAC progression. (A) Immunohistochemical detection of HuR expression in chronic pancreatitis (Ch Pan), PanIN-1, PanIN-2, and PDAC. Representative tissue sections were examined for HuR expression and counterstained with hematoxylin. Scale bars, 100 μm. (B) Immunoreactivity scores (IRS) for HuR expression in tissue sections of Ch Pan, PanIN-1, PanIN-2, and PDAC. *, P < 0.05; **, P < 0.01.

Similar articles

Cited by

References

    1. Blanco FF, Jimbo M, Wulfkuhle J, Gallagher I, Deng J, Enyenihi L, Meisner-Kober N, Londin ER, Rigoutsos I, Sawicki JA, Risud MV, Witkiewicz AK, McCue PA, Jiang W, Rui H, Yeo CJ, Petricoin EF, Winter JM, Brody JR. 2016. The mRNA-binding protein HuR promotes hypoxia-induced chemoresistance through posttranscriptional regulation of the proto-oncogene PIM1 in pancreatic cancer cells. Oncogene 35:2529–2541. doi:10.1038/onc.2015.325. - DOI - PMC - PubMed
    1. Costantino CL, Witkiewicz AK, Kuwano Y, Cozzitorto JA, Kennedy EP, Dasgupta A, Keen JC, Yeo CJ, Gorospe M, Brody JR. 2009. The role of HuR in gemcitabine efficacy in pancreatic cancer: HuR up-regulates the expression of the gemcitabine metabolizing enzyme deoxycytidine kinase. Cancer Res 69:4567–4572. doi:10.1158/0008-5472.CAN-09-0371. - DOI - PMC - PubMed
    1. Lal S, Burkhart RA, Bhattacharjee V, Beeharry N, Londin ER, Cozzitorto JA, Romeo C, Jimbo M, Norris ZA, Yeo CJ, Sawicki JA, Winter JM, Rigoutsos I, Yen TJ, Brody JR. 2014. HuR post-transcriptionally regulates WEE1: implications for the DNA damage response in pancreatic cancer cells. Cancer Res 74:1128–1140. doi:10.1158/0008-5472.CAN-13-1915. - DOI - PMC - PubMed
    1. Lal S, Zarei M, Chand SN, Dylgjeri E, Mambelli-Lisboa NC, Pishvaian MJ, Yeo CJ, Winter JM, Brody JR. 2016. Wee1 inhibition in pancreatic cancer cells is dependent on DNA repair status in a context dependent manner. Sci Rep 6:33323. doi:10.1038/srep33323. - DOI - PMC - PubMed
    1. McAllister F, Pineda DM, Jimbo M, Lal S, Burkhart RA, Moughan J, Winter KA, Abdelmohsen K, Gorospe M, Acosta AdJ, Lankapalli RH, Winter JM, Yeo CJ, Witkiewicz AK, Iacobuzio-Donahue CA, Laheru D, Brody JR. 2014. dCK expression correlates with 5-fluorouracil efficacy and HuR cytoplasmic expression in pancreatic cancer. Cancer Biol Ther 15:688–698. doi:10.4161/cbt.28413. - DOI - PMC - PubMed

Publication types

MeSH terms