. 2018 Jan 25;62(2):e01550-17.
doi: 10.1128/AAC.01550-17. Print 2018 Feb.

What Is Resistance? Impact of Phenotypic versus Molecular Drug Resistance Testing on Therapy for Multi- and Extensively Drug-Resistant Tuberculosis

Affiliations

What Is Resistance? Impact of Phenotypic versus Molecular Drug Resistance Testing on Therapy for Multi- and Extensively Drug-Resistant Tuberculosis

Jan Heyckendorf et al. Antimicrob Agents Chemother. .

Abstract

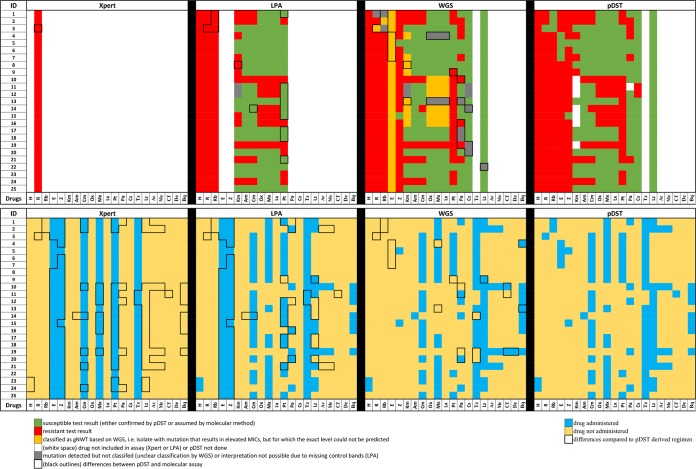
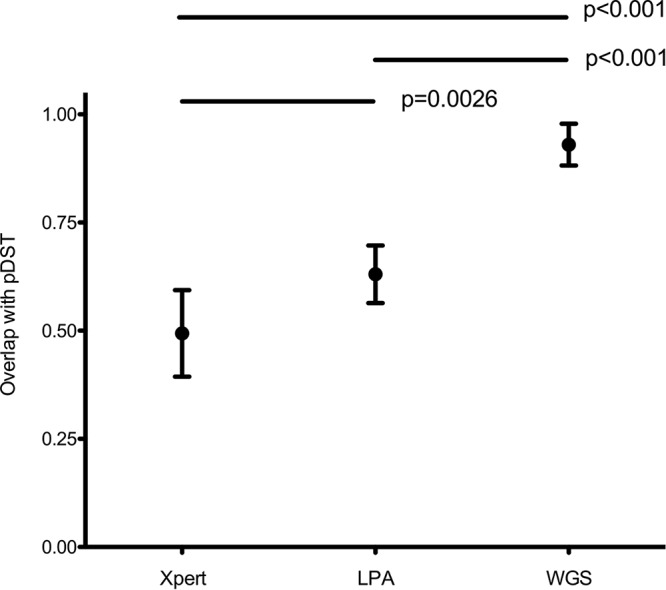
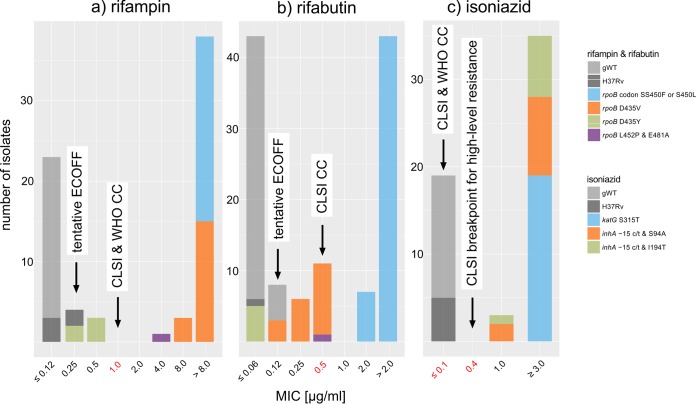
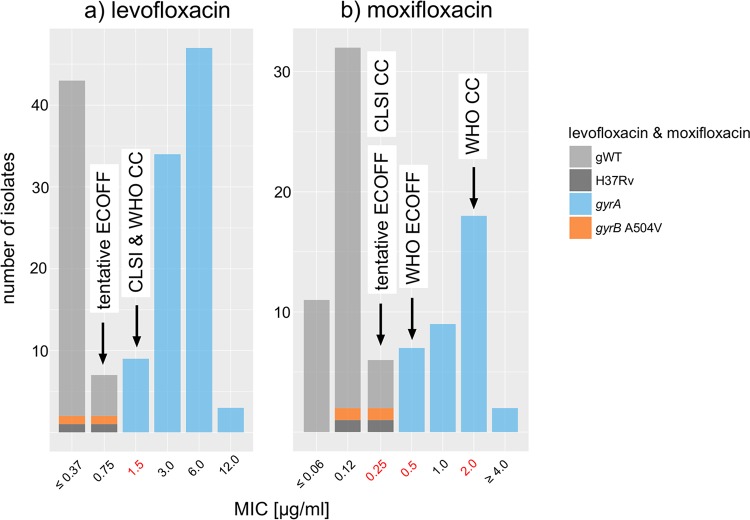
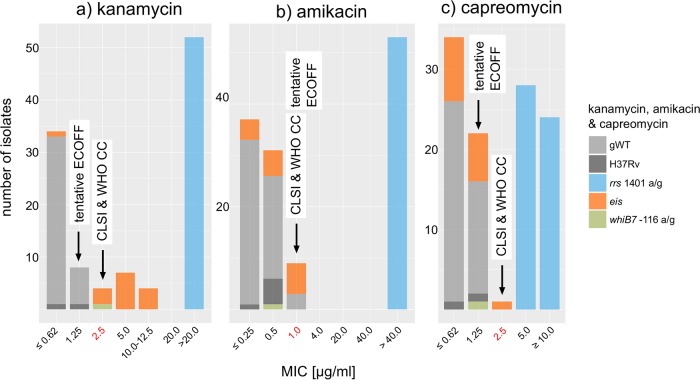
Rapid and accurate drug susceptibility testing (DST) is essential for the treatment of multi- and extensively drug-resistant tuberculosis (M/XDR-TB). We compared the utility of genotypic DST assays with phenotypic DST (pDST) using Bactec 960 MGIT or Löwenstein-Jensen to construct M/XDR-TB treatment regimens for a cohort of 25 consecutive M/XDR-TB patients and 15 possible anti-TB drugs. Genotypic DST results from Cepheid GeneXpert MTB/RIF (Xpert) and line probe assays (LPAs; Hain GenoType MTBDRplus 2.0 and MTBDRsl 2.0) and whole-genome sequencing (WGS) were translated into individual algorithm-derived treatment regimens for each patient. We further analyzed if discrepancies between the various methods were due to flaws in the genotypic or phenotypic test using MIC results. Compared with pDST, the average agreement in the number of drugs prescribed in genotypic regimens ranged from just 49% (95% confidence interval [CI], 39 to 59%) for Xpert and 63% (95% CI, 56 to 70%) for LPAs to 93% (95% CI, 88 to 98%) for WGS. Only the WGS regimens did not contain any drugs to which pDST showed resistance. Importantly, MIC testing revealed that pDST likely underestimated the true rate of resistance for key drugs (rifampin, levofloxacin, moxifloxacin, and kanamycin) because critical concentrations (CCs) were too high. WGS can be used to rule in resistance even in M/XDR strains with complex resistance patterns, but pDST for some drugs is still needed to confirm susceptibility and construct the final regimens. Some CCs for pDST need to be reexamined to avoid systematic false-susceptible results in low-level resistant isolates.

Keywords: Mycobacterium tuberculosis; antibiotic resistance; molecular genetics.


Figures

FIG 1
FIG 1
Comparison of pDST, Xpert, LPA, and WGS results and corresponding regimens. (Upper) Results for pDST and molecular methods (Xpert, LPAs, and WGS) for 25 M. tuberculosis isolates from patients with M/XDR-TB. Test results denoting either confirmed phenotypic susceptibility or assumed susceptibility based on genotypic methods are shown in green, those denoting resistance are in red, gNWT variants with elevated MICs are in orange, and mutations with unclear effects are in gray. Differences between Xpert, LPA, and WGS results compared to those of the pDST are outlined by black margins (both gNWT and unclear variants were assumed to be resistant for the purposes of designing the regimens and results between DST methods). (Lower) Standard algorithm-derived treatment regimens based on respective results of pDST, LPAs, WGS, and Xpert. Differences of resulting therapy regimens compared to the pDST-derived treatments are highlighted by black boxes. Vertical bars indicate data for 15 drugs for each patient, i.e., from left to right, isoniazid (H), rifampin (R), rifabutin (Rb), ethambutol (E), pyrazinamide (Z), kanamycin (Km), amikacin (Am), capreomycin (Cm), ofloxacin (Ox), moxifloxacin (Mx), levofloxacin (Lx), prothionamide (Pt), para-aminosalicylic acid (Pa), cycloserine (Cs), terizidone (Tz), linezolid (Lz), amoxicillin-clavulanic acid (Ac), meropenem (Me), clofazimine (Cf), delamanid (De), and bedaquiline (Bq).
FIG 2
FIG 2
Average overlap of different regimens based on molecular DST assays compared with pDST results. Standard algorithm-derived treatment regimens based on results of Xpert, LPAs, and WGS (x axis) with their mean overlap to standard algorithm-derived treatment regimens based on pDST results (y axis). Mean overlaps (dots) are expressed with 95% confidence intervals (bars). P values assessing the differences between the mean overlaps between the treatment regimens are shown above.
FIG 3
FIG 3
MIC distributions for rifampin, rifabutin, and isoniazid. (A and B) The CCs for rifampin and rifabutin were two dilutions higher than the tentative ECOFFs defined based on the pooled MIC data from this study and the literature (i.e., 1 versus 0.25 μg/ml for rifampin and 0.5 versus 0.12 μg/ml for rifabutin) (17). These distinctions did not make a difference for isolates with rpoB S450F or S450L mutations, which resulted in large MIC increases for both drugs. In contrast, the result of susceptible/resistant to rifampin by pDST for the rpoB D435Y isolate (11102-14), as well as the rifabutin results for the rpoB D435V and L452P/E481A isolates (12041-13 and 999-13), likely were breakpoint artifacts, as the isolates had elevated MICs compared to those of gWT isolates and the H37Rv laboratory strain. In contrast, the rpoB D435Y isolate appeared to be genuinely susceptible to rifabutin. However, lowering the CCs for both drugs to the ECOFFs would not necessarily ensure that isolates with elevated MICs always test resistant phenotypically. For example, because the MIC distribution of rpoB D435V (0.12 to 0.5 μg/ml) overlapped the gWT distribution of rifabutin, the normal variation in MIC testing would result in a poor reproducibility of pDST for this mutation. (C) WHO has only endorsed a single critical concentration for isoniazid, whereas CLSI has set an additional breakpoint that defines high-level resistance. Some treatment guidelines recommend the treatment of low-level resistant strains with a high dose of isoniazid (18). All mutant isolates were found to be resistant even at the second CLSI breakpoint, which was in accordance with our prediction based on WGS data (18). This would not have been apparent using the GenoType MTBDRplus assay, given that it only interrogates inhA promoter mutations, which typically result in low MICs, although this did not affect our interpretation of the assay, since we only relied on the WHO CCs (18).
FIG 4
FIG 4
MIC distributions for levofloxacin and moxifloxacin. The pooled MIC data identified potential breakpoint artifacts for both agents. First, the CLSI and WHO critical concentrations for levofloxacin were one dilution higher than the tentative ECOFF defined in this study (1.5 versus 0.75 μg/ml) (11, 14). Second, the pooled data supported the current CLSI critical concentration (0.25 μg/ml) as the tentative ECOFF for moxifloxacin rather than the value set by WHO (0.5 μg/ml), which is designed as a surrogate for testing resistance to ofloxacin and levofloxacin (24). Moreover, WHO has acknowledged that the critical concentration at 2 μg/ml, which defines resistance to moxifloxacin, may be too high (24). Because two isolates with different genetic backgrounds shared the same gyrB A504V mutations, which is typically a signal of positive selection, these isolates were categorized as unclear. However, MIC testing revealed MICs that were equal to or below even the tentative ECOFFs for both fluoroquinolones, which was in line with allelic exchange experiments (59).
FIG 5
FIG 5
MIC distributions for kanamycin, amikacin, and capreomycin. The direct alteration of rrs, the shared target of kanamycin, amikacin, and capreomycin, via the A1401G mutation is known to confer unequivocal cross-resistance to all three drugs, which was in agreement with the pooled MIC data (60). In contrast, the current CCs for kanamycin were found to truncate the MIC distribution for isolates with eis and whiB7 mutations (27). This meant that isolates with a MIC of 2.5 μg/ml were misclassified as susceptible despite the fact that these included mutations had been shown to result in elevated MICs using allelic exchange experiments (i.e., eis −37 g/t, eis −10 g/a, and whiB7 −116 a/g) (25, 26). In contrast, neither eis nor whiB7 mutations had a significant impact on the MICs of amikacin or capreomycin (based on previous data, the fact that the tentative ECOFF for capreomycin for our study was below the critical concentration was likely an artifact due to the small number of gWT isolates included in this study) (61).

Comment in

References

    1. World Health Organization. 2016. Global tuberculosis report. World Health Organization, Geneva, Switzerland: http://apps.who.int/iris/bitstream/10665/250441/1/9789241565394-eng.pdf?....
    1. Lange C, Abubakar I, Alffenaar JWC, Bothamley G, Caminero Ja Carvalho ACC, Chang KC, Codecasa L, Correia A, Crudu V, Davies P, Dedicoat M, Drobniewski F, Duarte R, Ehlers C, Erkens C, Goletti D, Günther G, Ibraim E, Kampmann B, Kuksa L, De Lange W, Van Leth F, Van Lunzen J, Matteelli A, Menzies D, Monedero I, Richter E, Rüsch-Gerdes S, Sandgren A, Scardigli A, Skrahina A, Tortoli E, Volchenkov G, Wagner D, Van Der Werf MJ, Williams B, Yew WW, Zellweger JP, Cirillo DM. 2014. Management of patients with multidrugresistant/extensively drug-resistant tuberculosis in Europe: a TBNET consensus statement. Eur Respir J 44:23–63. doi:10.1183/09031936.00188313. - DOI - PMC - PubMed
    1. Horsburgh CR Jr, Barry CE III, Lange C. 2015. Treatment of tuberculosis. N Engl J Med 373:2149–2160. doi:10.1056/NEJMra1413919. - DOI - PubMed
    1. Köser CU, Ellington MJ, Cartwright EJ, Gillespie SH, Brown NM, Farrington M, Holden MT, Dougan G, Bentley SD, Parkhill J, Peacock SJ. 2012. Routine use of microbial whole genome sequencing in diagnostic and public health microbiology. PLoS Pathog 8:e1002824. doi:10.1371/journal.ppat.1002824. - DOI - PMC - PubMed
    1. Köser CU, Bryant JM, Becq J, Török ME, Ellington MJ, Marti-Renom MA, Carmichael AJ, Parkhill J, Smith GP, Peacock SJ. 2013. Whole-genome sequencing for rapid susceptibility testing of M. tuberculosis. N Engl J Med 369:290–292. doi:10.1056/NEJMc1215305. - DOI - PMC - PubMed

Publication types

MeSH terms

LinkOut - more resources