. 2017 Dec 15;130(24):4180-4192.
doi: 10.1242/jcs.206854. Epub 2017 Nov 13.

Quantitative analysis of multilayer organization of proteins and RNA in nuclear speckles at super resolution

Affiliations

Quantitative analysis of multilayer organization of proteins and RNA in nuclear speckles at super resolution

Jingyi Fei et al. J Cell Sci. .

Abstract

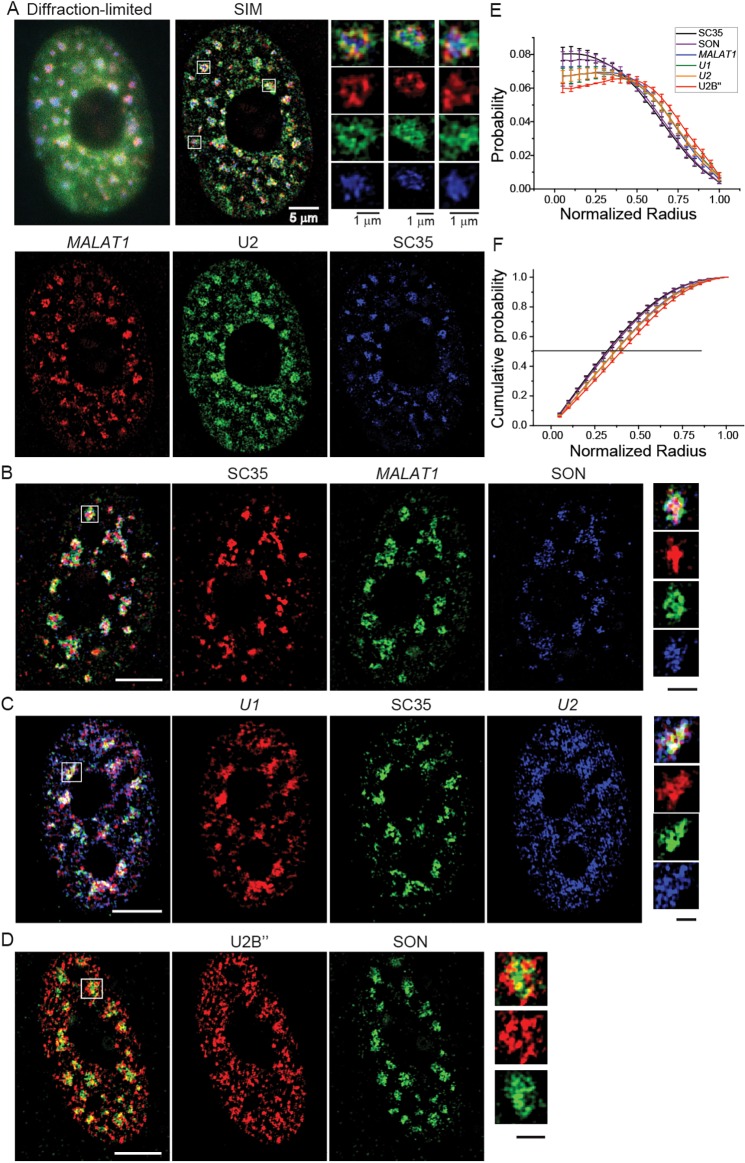
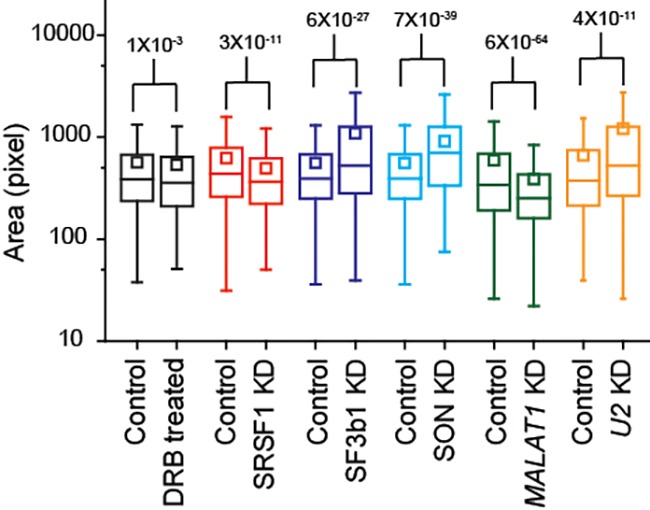
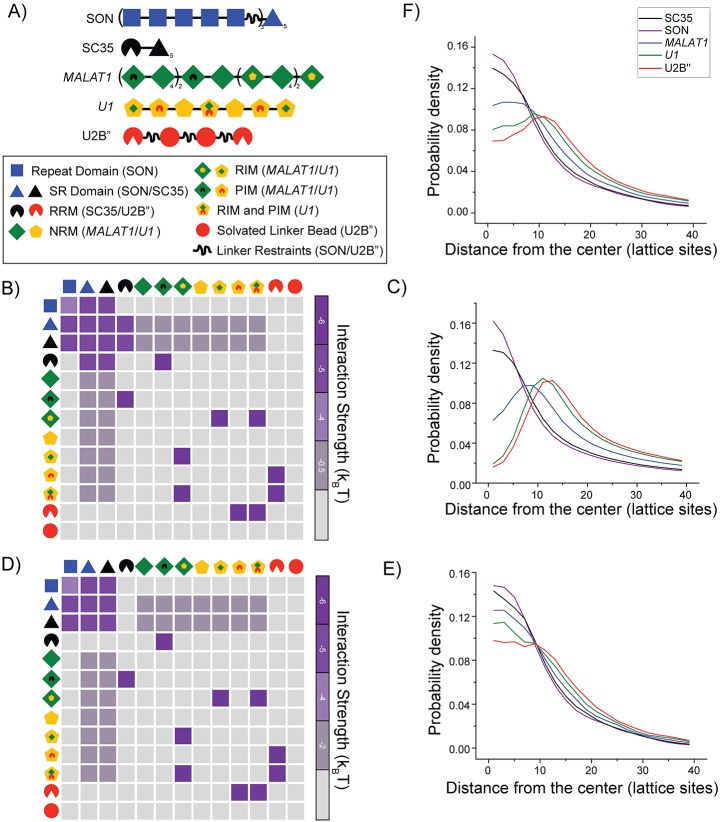
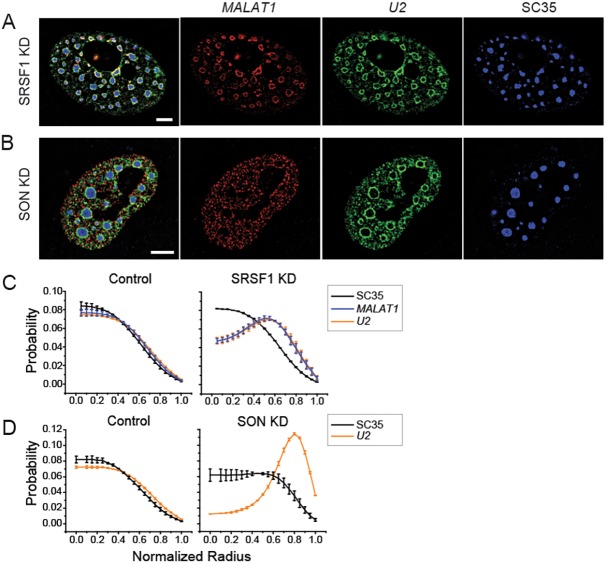
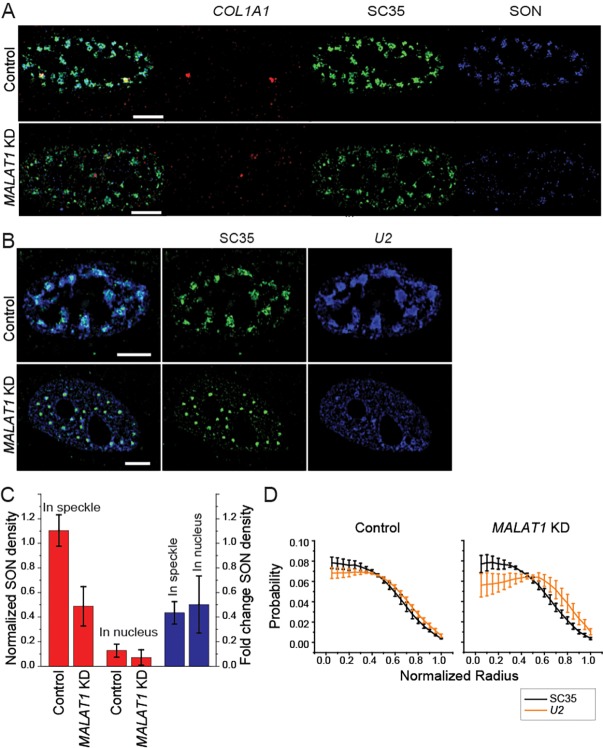
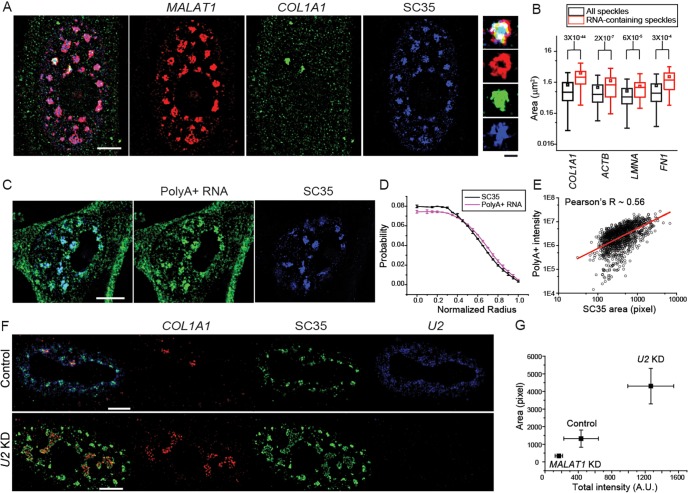
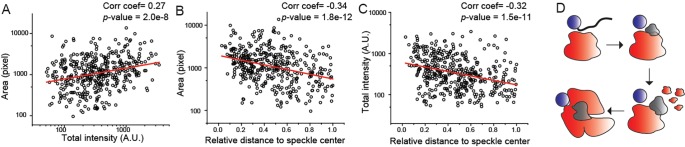
Nuclear speckles are self-assembled organelles composed of RNAs and proteins. They are proposed to act as structural domains that control distinct steps in gene expression, including transcription, splicing and mRNA export. Earlier studies identified differential localization of a few components within the speckles. It was speculated that the spatial organization of speckle components might contribute directly to the order of operations that coordinate distinct processes. Here, by performing multi-color structured illumination microscopy, we characterized the multilayer organization of speckles at a higher resolution. We found that SON and SC35 (also known as SRSF2) localize to the central region of the speckle, whereas MALAT1 and small nuclear (sn)RNAs are enriched at the speckle periphery. Coarse-grained simulations indicate that the non-random organization arises due to the interplay between favorable sequence-encoded intermolecular interactions of speckle-resident proteins and RNAs. Finally, we observe positive correlation between the total amount of RNA present within a speckle and the speckle size. These results imply that speckle size may be regulated to accommodate RNA accumulation and processing. Accumulation of RNA from various actively transcribed speckle-associated genes could contribute to the observed speckle size variations within a single cell.

Keywords: Long noncoding RNA; Nuclear domain; Splicing factor; Sub-nuclear compartmentalization.


Conflict of interest statement

Competing interestsS.M.F. is an employee of Ionis Pharmaceuticals and receives salary from the company.

Figures

Fig. 1.
Fig. 1.
Nuclear speckle components demonstrate a layered organization. (A) Sample image of MALAT1 (red), U2 (green) and SC35 (blue) with diffraction-limited fluorescence microscopy and SIM. Images are rendered in ImageJ for the center z-plane of the cell. (B) Combination images of SC35 (red), MALAT1 (green) and SON (blue). (C) Combination images of U1 (red), SC35 (green) and U2 (blue). (D) Combination images of U2B″ (red) and SON (green). (E) Probability density distribution as a function of the radius for each component from the geometric center of the speckle. The radius is normalized to the distance from the center (set to 0) to the boundary of the speckle (set to 1). (F) Cumulative probability distribution as a function of radius for each component from the geometric center of the speckle. Error bars in E and F represent standard deviation from at least three independent measurements. Each measurement contains 150–400 speckles from 15–40 cells on average. Scale bars: 5 µm, cell images; 1 µm, magnified speckle images.
Fig. 2.
Fig. 2.
Comparison of speckle size under various conditions. Size of the speckles as observed by SC35 staining is presented by the area of the speckle in the middle z slice, and shown in the box-and-whisker plots. P-values (calculated with a Kolmogorov–Smirnov test) are reported above the plots. For all box-and-whisker plots, the bottom and top of the box are the first and third quartiles; the band inside the box reports the median; whisker lines report 1.5× the interquartile range (IQR) and the central square represents the mean value. All speckles from 2–4 independent experiments are combined. Each experiment examined 500–1000 speckles from 30–60 cells (1000–4000 speckles from multiple experiments).
Fig. 3.
Fig. 3.
Multilayer organization is demonstrated in lattice-based computer simulations of a five-component system. (A) Coarse-grained modular architectures of SON, SC35, MALAT1, U1/U2 and U2B″ with a key to help identify the different modules within the five molecules. Here, RRM, NRM, RIM, and PIM are acronyms that refer to RNA recognition module, non-specific RNA module, RNA interaction module (on RNA molecules) and protein interaction modules (on RNA molecules). Depending on the macromolecule of interest, connected beads are constrained to either nearest neighbor (straight connectors) or second nearest neighbor (squiggly connectors) lattice sites. (B,D) Interaction matrices are used to model the effective solvent-mediated pairwise interactions between modules. The color bar on the right shows the interaction strength in terms of thermal energy. A gray cell implies that the solvation of the module is preferred over pairwise interaction between the pair of modules. Of special note, the weakest interaction color has different values in these two interaction tables. For the ease of viewing, we have omitted from the energy table and polymer definition for the MALAT1MALAT1 interaction. Every third MALAT1 module, starting from the second, can interact with any other MALAT1 module on such spacing with an interaction strength equal to the MALAT1U1 interaction. (C,E) Probability density for each of the five components plotted against the distance from the geometric center of the largest cluster. The distance is in units of the number of lattice sites. (F) Combined probability densities from C and E to match the two populations observed experimentally.
Fig. 4.
Fig. 4.
Effect of SR protein knockdown on speckle organization. Sample image of MALAT1 (red), U2 (green) and SC35 (blue) in the WI-38 cells depleted for SRSF1 (A) and SON (B). An example of a corresponding control cell with the same labeling scheme is shown in Fig. S2F. Scale bars: 5 µm. Average radial distribution of MALAT1, U2 and SC35 in WI-38 cells depleted for SRSF1 (C) and SON (B). Error bars represent the standard deviation from two independent measurements. Each measurement contains 500–1000 speckles from 30–60 cells.
Fig. 5.
Fig. 5.
Effect of MALAT1 knockdown on speckle. (A) Sample image of COL1A1 mRNA (red), SC35 (green) and SON (blue) in the control and MALAT1-depleted cells. (B) Sample image of SC35 (green) and U2 (blue) in the control and MALAT1-depleted cells. Scale bars: 5 µm. (C) Normalized SON density for the control and MALAT1-knockdown (KD) cells. Density is calculated by dividing the total intensity by the volume of either the speckles or the whole nucleus. Error bars report the standard deviation. (D) Average radial distribution of U2 and SC35 in the control and MALAT1-knockdown background. Error bars report the standard deviation. All plots contain data from three or four independent measurements. Each measurement contains 300–1000 speckles from 20–60 cells.
Fig. 6.
Fig. 6.
RNA accumulation contributes to speckle size variation. (A) Sample image of MALAT1 (red), COL1A1 RNA (green) and SC35 (blue). (B) Box-and-whisker plot of the areas of RNA accumulation site-associated speckles and all speckles from the same cells. P-values (calculated with a Kolmogorov–Smirnov test) are indicated above the plots. All box-and-whisker plots are presented as described in Fig. 2. (C) Sample image of poly(A)-positive (PolyA+) RNA (green) and SC35 (blue). (D) Average radial distribution of poly(A)-positive RNA and SC35. Error bars report standard deviation. (E) Scatter plot of total intensity of poly(A)-positive RNA versus speckle size defined by SC35. The red line designates the linear fitting of the data. (F) Sample image of COL1A1 mRNA (red), SC35 (green) and U2 snRNA (blue) in the control and U2-knockdown (KD) cells. (G) RNA-associated speckle size versus total RNA intensity in the control, MALAT1-knockdown and U2-knockdown cells. Error bars report the standard deviation. Scale bars: 5 µm, cell images; 1 µm, magnified speckle images. All plots contain data from 2–4 independent measurements. Each measurement contains data from 300–1000 speckles and 15–70 RNA-containing speckles from 20–60 cells.
Fig. 7.
Fig. 7.
Correlation between speckle size and total RNA accumulation at single speckle level. (A) Scatter plot of RNA-associated speckle size versus total RNA intensity at the accumulation site for individual speckles. (B) Scatter plot of RNA-associated speckle size versus DRel. (C) Scatter plot of total RNA intensity versus DRel. The red lines show the linear fitting of the data. All plots contain data from three or four independent measurements. Each measurement contains 15–70 RNA-containing speckles from 20–50 cells. (D) Model for describing the effect of mRNA accumulation on the speckle size increase: gene (purple); RNA transcript (gray) and speckle (red).

References

    1. Ando T., Yamayoshi S., Tomita Y., Watanabe S., Watanabe T. and Kawaoka Y. (2016). The host protein CLUH participates in the subnuclear transport of influenza virus ribonucleoprotein complexes. Nature Microbiology 1, 16062 10.1038/nmicrobiol.2016.62 - DOI - PubMed
    1. Änkö M.-L., Müller-McNicoll M., Brandl H., Curk T., Gorup C., Henry I., Ule J. and Neugebauer K. M. (2012). The RNA-binding landscapes of two SR proteins reveal unique functions and binding to diverse RNA classes. Genome Biol. 13, R17 10.1186/gb-2012-13-3-r17 - DOI - PMC - PubMed
    1. Banani S. F., Rice A. M., Peeples W. B., Lin Y., Jain S., Parker R. and Rosen M. K. (2016). Compositional control of phase-separated cellular bodies. Cell 166, 651-663. 10.1016/j.cell.2016.06.010 - DOI - PMC - PubMed
    1. Banani S. F., Lee H. O., Hyman A. A. and Rosen M. K. (2017). Biomolecular condensates: organizers of cellular biochemistry. Nat. Rev. Mol. Cell Biol. 18, 285-298. 10.1038/nrm.2017.7 - DOI - PMC - PubMed
    1. Bernard D., Prasanth K.V., Tripathi V., Colasse S., Nakamura T., Xuan Z., Zhang M.Q., Sedel F., Jourdren L., Coulpier F., et al. (2010). A long nuclear-retained non-coding RNA regulates synaptogenesis by modulating gene expression. EMBO J 29, 3082-3093. 10.1038/emboj.2010.199 - DOI - PMC - PubMed