. 2017 Nov 13;8(1):1462.
doi: 10.1038/s41467-017-01602-4.

mTOR intersects antibody-inducing signals from TACI in marginal zone B cells

Affiliations

mTOR intersects antibody-inducing signals from TACI in marginal zone B cells

Jordi Sintes et al. Nat Commun. .

Abstract

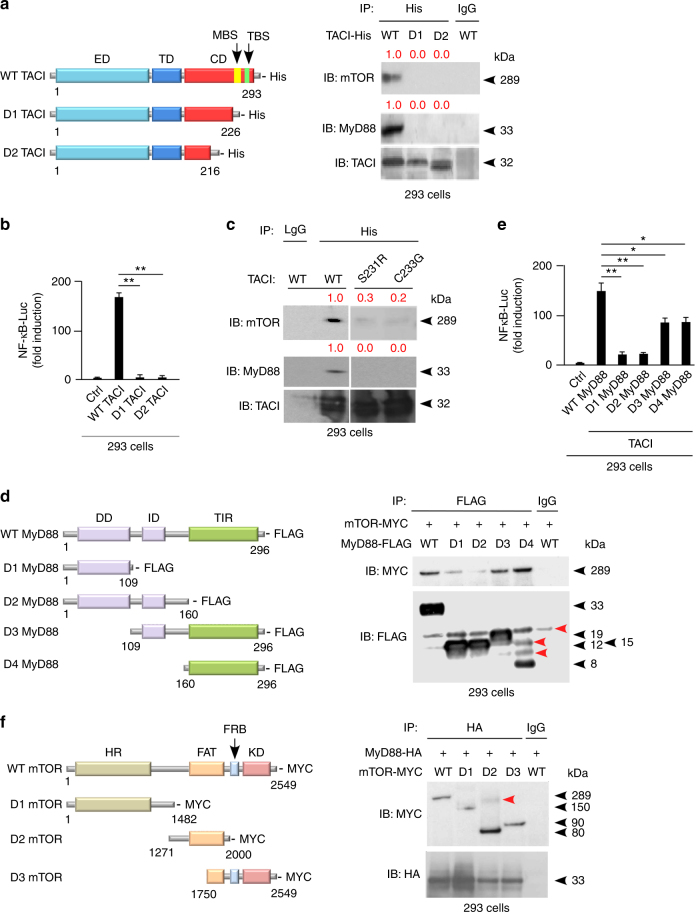
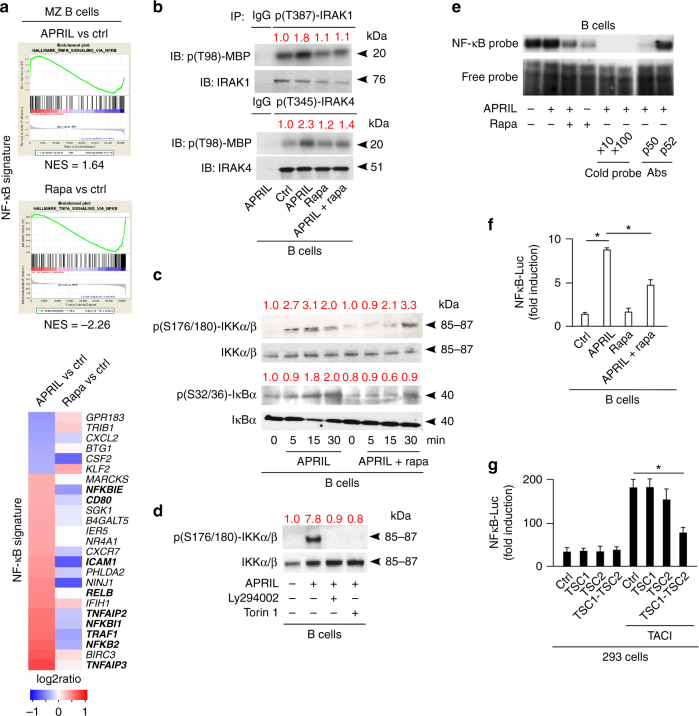
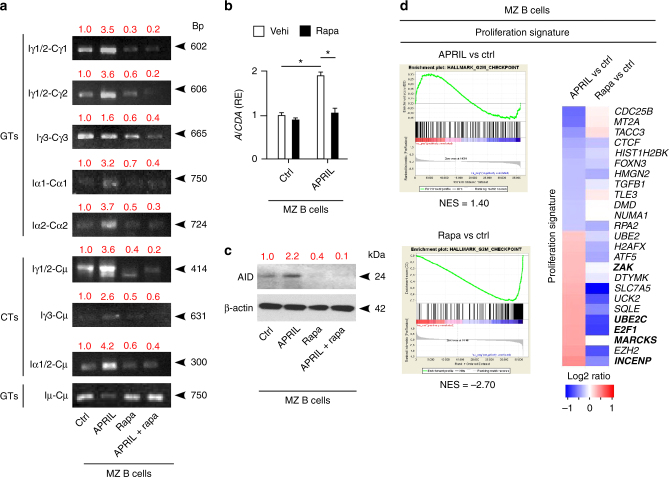
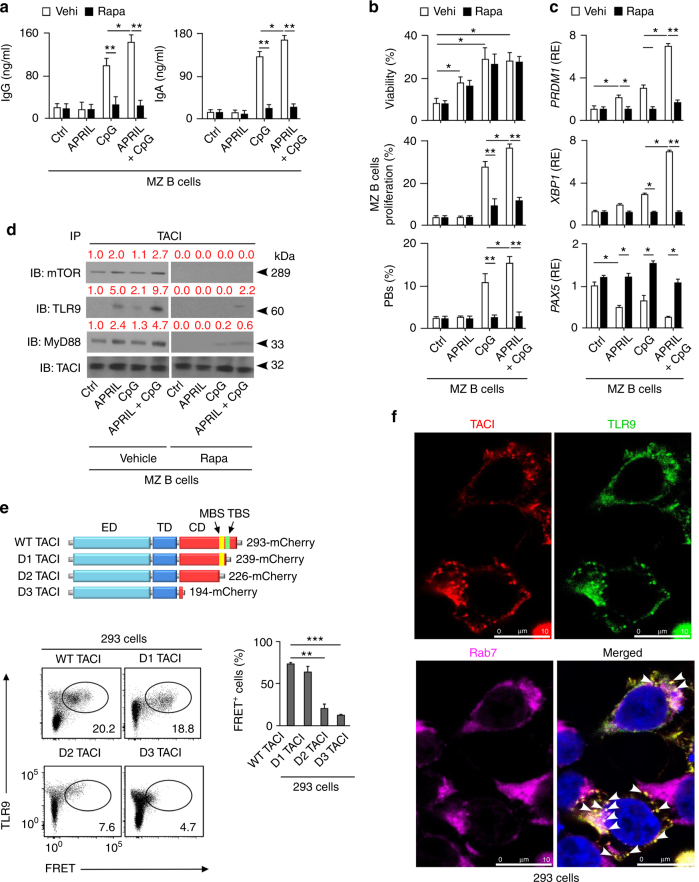
Mechanistic target of rapamycin (mTOR) enhances immunity in addition to orchestrating metabolism. Here we show that mTOR coordinates immunometabolic reconfiguration of marginal zone (MZ) B cells, a pre-activated lymphocyte subset that mounts antibody responses to T-cell-independent antigens through a Toll-like receptor (TLR)-amplified pathway involving transmembrane activator and CAML interactor (TACI). This receptor interacts with mTOR via the TLR adapter MyD88. The resulting mTOR activation instigates MZ B-cell proliferation, immunoglobulin G (IgG) class switching, and plasmablast differentiation through a rapamycin-sensitive pathway that integrates metabolic and antibody-inducing transcription programs, including NF-κB. Disruption of TACI-mTOR interaction by rapamycin, truncation of the MyD88-binding domain of TACI, or B-cell-conditional mTOR deficiency interrupts TACI signaling via NF-κB and cooperation with TLRs, thereby hampering IgG production to T-cell-independent antigens but not B-cell survival. Thus, mTOR drives innate-like antibody responses by linking proximal TACI signaling events with distal immunometabolic transcription programs.


Conflict of interest statement

The authors declare no competing financial interests.

Figures

Fig. 1
Fig. 1
MZ B cells couple increased TACI expression with enhanced mTORC1 signaling. a Transmission electron microscopy of human splenic follicular (FO) and MZ B cells. Original magnification ×13,500 with 6× enlargement. Scale bars, 1 or 0.2 μm. b Flow cytometric analysis of LysoTracker, ER-Tracker, MitoTracker, and Golgi in human splenic FO and MZ B cells. SSC-A side scatter-area. c, d Transcriptome analysis of human splenic FO and MZ B cells. The heat map shows genes upregulated in FO (1302) and MZ (800) B cells and highlights a core MZ B-cell gene signature. The volcano plot summarizes comparably and differentially expressed genes. Red high expression, blue low expression, FC fold change, FDR false discovery rate. e FCM of human splenic FO and MZ B cells undergoing proliferation-induced CFSE dilution or CD19+CD27hiCD38hi plasmablast differentiation following incubation with or without APRIL and/or CpG for 5 days. f Gene ontology analysis showing top seven biological processes upregulated (red) and downregulated (blue) by human MZ B cells compared to FO B cells. Numbers indicate genes. g, h Heat maps list top 10 genes similarly enriched or depleted in GSEA comparing genes expressed by human splenic MZ and FO B cells linked to mTORC1 activation (HALLMARK_MTORC1) (g) or PC differentiation (GSE22886) (h). i IFA of human spleen stained for IgD (red), p(S235/S236)-S6 (green), and MAdCAM-1 (blue). Scale bars, 100 μm (main image) or 10 μm (inset). j, k FCM of p(T308)-AKT, p(S473)-AKT, p(S235/S236)-S6, and CD98 in human FO and MZ B cells. Cells were gated as in Supplementary Fig. 11a (b, j, k). Data show one representative experiment of at least three with similar results (a, b, ik), depict at least three biological replicates for each cell type (c, d, f-h), or summarize at least two experiments with at least two donors from each experimental group (e). Error bars, s.e.m.; *p < 0.05, **p < 0.01, ***p < 0.001 (two-tailed Student’s t test)
Fig. 2
Fig. 2
TACI activates mTORC1 signaling by recruiting mTOR. a FCM of TACI and BCMA on human splenic FO and MZ B cells. Cells were gated as in Supplementary Fig. 11a b. Heat map showing enrichment or depletion of coordinated gene sets identified by GSEA in the transcriptome from human MZ B cells cultured for 3 h with or without APRIL and/or rapamycin (rapa). Ctrl medium. NES indicates correlation between individual gene sets. Positive correlation, NES > 0 (yellow gradient); negative correlation, NES < 0 (blue gradient). c GSEA of the mTORC1 gene signature identified in b and heat map listing top 25 genes similarly enriched or depleted under different treatment conditions. Colors correspond to significant FC expression: red, high; blue, low. Bold indicates genes discussed in the text. d IB of total or p(S2448)-mTOR, p(37/46)-4E-BP1, p(T389)-70S6K, and p(S235/236)-S6 in human splenic IgD+ B cells incubated for 0, 5, 15, or 30 min with APRIL in the presence or absence of rapamycin. Red numbers indicate band intensity relative to total protein. e IB of total or p(S235/236)-S6 in human splenic IgD+ B cells incubated for 15 min with APRIL in the presence or absence of Ly294002 or Torin 1. f Phospho-proteome analysis of p(S235/236)-S6, p(T308)-AKT, and p(S473)-AKT from human splenic MZ B cells stimulated with APRIL for 15 min. Graphs show mean pixel density of dot blots. OD optical density. g IB of mTOR, MyD88, TRAF2, IRAK-4, IRAK-1, and TACI following IP with anti-TACI or irrelevant IgG of protein lysates from splenic IgD+ B cells incubated with or without APRIL and/or rapamycin for 15 min. Ctrl, medium alone. h FCM of WT and S194X TACI on lymphoblastoid B cells from a healthy donor (HD) or a common variable immunodeficiency (CVID) patient, respectively. i IB of mTOR, MyD88, and TACI following IP with anti-TACI or irrelevant IgG antibodies of protein lysates from B cells shown in h stimulated as in g. Data summarize one representative experiment with at least three biological replicates for each cell type (ac, f, h) or show one experiment of at least three with similar results (d, e, g, i). Error bars, s.e.m.; *p < 0.05 (two-tailed Student’s t test)
Fig. 3
Fig. 3
TACI uses a MyD88-binding site to attach the central domain of mTOR. a Left graphs: structure of His-tagged WT TACI or D1 and D2 TACI deletion mutants. Numbers indicate C-terminal and N-terminal residues. ED extracellular domain, TD transmembrane domain, CD cytoplasmic domain. Right gels: IB of mTOR, MyD88 and TACI following IP with anti-His or irrelevant IgG antibodies of protein lysates from transfected 293 cells expressing WT, D1, or D2 TACI. Red numbers indicate band intensity relative to TACI. b NF-κB luciferase (NF-κB-Luc) reporter assay of 293 cells transfected with WT or mutant TACI shown as in a. Ctrl, 293 cells transfected with an empty plasmid. c IB of mTOR, MyD88, and TACI following IP with anti-His or irrelevant IgG antibodies of protein lysates from transfected 293 cells expressing His-tagged WT TACI or mutant TACI proteins with site-targeted substitutions inhibiting MyD88 binding to the cytoplasmic MBS of TACI, including S231R TACI and C233G TACI. d Left graphs: structure of FLAG-tagged WT MyD88 or D1, D2, D3, and D4 MyD88 deletion mutants. Right gels: IB of MYC and FLAG following IP with anti-FLAG or irrelevant IgG antibodies of protein lysates from co-transfected 293 cells expressing FLAG-tagged WT, D1, D2, D3, and D4 MyD88 together with MYC-tagged mTOR. Red arrows indicate nonspecific bands. e NF-κB-Luc reporter assay of 293 cells co-transfected with WT TACI and WT or mutant MyD88 shown in d for 24 h. Ctrl, 293 cells transfected with an empty plasmid. f Left graphs: structure of MYC-tagged WT mTOR or D1, D2, and D3 mTOR deletion mutants. FAT stands for FRAP, ATM, TRRAP domain. Right gels: IB of MYC and HA following IP with anti-HA or irrelevant IgG antibodies of protein lysates from co-transfected 293 cells expressing MYC-tagged WT, D1, D2, and D3 mTOR together with HA-tagged MyD88. Data represent one of three experiments with similar results (a, c, d, f) or summarize three experiments (b, e). Error bars, s.e.m.; *p < 0.05, *p < 0.01 (two-tailed Student’s t test)
Fig. 4
Fig. 4
TACI activates the CSR-inducing transcription factor NF-κB through mTORC1. a GSEA showing enrichment or depletion of coordinated NF-κB gene sets from human splenic MZ B cells cultured for 3 h with or without APRIL or rapamycin (rapa). Ctrl, medium alone. NES indicates correlation between individual gene sets. Positive correlation, NES > 0; negative correlation, NES < 0. Heat map shows top 25 genes similarly enriched or depleted in MZ B cells exposed to different treatments. Colors correspond to significant FC expression: red (high); blue (low). Bold indicates genes discussed in the text. b IB of p(T98)-myelin basic protein (MBP), IRAK-1 and IRAK-4 following IP with anti-p(T387)-IRAK-1, p(T354)-IRAK-4, or irrelevant IgG of protein lysates from human 2E2 B cells cultured for 15 min with or without APRIL and/or rapamycin (rapa). Red numbers indicate band intensity relative to total proteins. c IB of total or p(S176/180)-IKKα/β and total or p(S32/36)-IκBα from human splenic IgD+ B cells incubated with APRIL in the presence or absence of rapamycin for 0, 5, 15, or 30 min. d IB of total or p(S176/180)-IKKα/β from human splenic IgD+ B cells incubated with or without APRIL in the presence or absence of Ly294002 or Torin 1 for 15 min. e EMSA of nuclear NF-κB bound to a radiolabeled κB DNA probe from human splenic IgD+ B cells incubated with APRIL in the presence or absence of rapamycin for 1 h (lanes 1–4). NF-κB–DNA interaction in the presence of increasing concentrations of a competing unlabeled cold probe (lanes 5–6) or blocking antibodies (Abs) to p50 and p52 NF-κB subunits (lanes 7–8) are also shown. f NF-κB-Luciferase (Luc) reporter assay of human EBV-transformed B cells incubated with APRIL in the presence or absence of rapamycin for 24 h. g NF-κB-Luc reporter assay of 293 cells expressing WT TACI with or without TSC1, TSC2, or both for 24 h. Ctrl, empty plasmid. Data summarize one representative experiment with at least three samples or biological replicates from each cell type (a, f, g), show one of at least three (b, d) or two (e) experiments with similar results. Error bars, s.e.m.; *p < 0.05 (two-tailed Student’s t test)
Fig. 5
Fig. 5
TACI triggers CSR by cooperating with TLR9 through mTORC1. a PCR analysis of Iγ1/2-Cγ1, Iγ1/2-Cγ2, Iγ3-Cγ3, Iα1-Cα1, Iα2-Cα2 and Iµ-Cµ germline transcripts (GTs) as well as Iγ1/2-Cµ, Iγ3-Cµ, Iα1/2-Cµ switch circle transcripts (SCTs) RT-PCR-amplified from human splenic MZ B cells incubated with APRIL in the presence or absence of rapamycin (rapa) for 3 days. Red numbers indicate band intensity relative to Iµ-Cµ bands. b qRT-PCR of mRNA for AID (AICDA) from human splenic MZ B cells incubated with APRIL in the presence of control vehicle (vehi) or rapamycin for 3 days. Results are normalized to β-actin mRNA and presented as relative expression (RE) compared to B cells incubated with medium alone (Ctrl). c IB of AID and β-actin from human splenic MZ B cells treated as in a. Red numbers indicate band intensity relative to β-actin. d GSEA showing enrichment or depletion of coordinated proliferation-related gene sets from human splenic MZ B cells cultured for 3 h with or without APRIL or rapamycin. Ctrl, medium alone. NES indicates correlation between individual gene sets. Positive correlation, NES > 0; negative correlation, NES < 0. Heat map showing top 25 genes similarly enriched or depleted in MZ B cells exposed to different treatments. Colors correspond to significant FC expression: red, high expression; blue, low expression. Bold indicates gene products discussed in the text. Data represent one of three experiments with similar results (a, c), summarize three experiments (b) or correspond to one experiment with three biological replicates (d). Error bars, s.e.m.; *p < 0.05, **p < 0.01 (two-tailed Student’s t test)
Fig. 6
Fig. 6
TACI interacts with active TLR9 and MyD88 through mTORC1. a ELISA of total IgG and IgA from human splenic MZ B cells cultured with or without APRIL and/or CpG and in the presence of control vehicle (vehi) or rapamycin (rapa) for 5 days. Ctrl, medium alone. b Frequency of viable cells, proliferated CFSElo cells and CD19+CD27hiCD38hi plasmablasts after culturing human splenic MZ B cells as in a. Proliferation data derive from experiments identical to those in Fig. 1e, which includes comparisons between MZ and follicular B cells with no exposure to rapamycin. c qRT-PCRs of mRNAs for BLIMP-1 (PRDM1), XBP-1 (XBP1), and PAX5 (PAX5) from human splenic MZ B cells cultured for 72 h as in a. Results are normalized to β-actin mRNA and presented as relative expression (RE) compared to B cells incubated with medium alone (ctrl). d IB of mTOR, TLR9, MyD88, and TACI following IP with an anti-TACI antibody of protein lysates from splenic IgD+ B cells cultured for 60 min with or without APRIL and/or CpG in the presence of control vehicle or rapamycin. Ctrl, medium alone. Red numbers indicate band intensity relative to TACI bands. e Top schematics: structure of mCherry-tagged WT TACI or D1, D2, and D3 TACI deletion mutants (acceptors) used in FRET assays. Bottom graphs: FCM of FRET signal in co-transfected 293 cells expressing donor TLR9-eYFP together with mCherry-tagged WT or mutant acceptor TACI proteins as well as frequency of FRET+ 293 cells (f) IFA of 293 cells stained for transfected TACI (red) and TLR9 (green) as well as endogenous endosomal Rab7 (magenta). Bar, 10 μm. White arrows indicate endosomal TACI-TLR9 co-localization. Data summarize two experiments with at least two donors in each experimental group (a, c, e), show one representative experiment of at least three with similar results (d, f), or correspond to three biological replicates for each cell type (b). Error bars, s.e.m.; *p < 0.05, **p < 0.01, ***p < 0.001 (two-tailed Student’s t test)
Fig. 7
Fig. 7
TACI requires mTOR to induce CSR in mouse MZ B cells. a FCM of p(S235/236)-S6 in splenic follicular and MZ B cells. Numbers in top panel indicate mean fluorescence intensity (MFI), whereas results from different experiments are summarized in bottom graph. Cells were gated as in Supplementary Fig. 11b. b ELISA of serum total and PCh-reactive IgM and IgG3 from WT and TNFSF13-Tg mice before (d0) and after (d7) daily i.p. treatment with rapamycin. c ELISA of serum TNP-specific IgM and IgG3 (d7) from WT and TNFSF13-Tg mice following i.p. immunization with TNP-Ficoll supplemented with daily i.p. injection of control vehicle or rapamycin. d ELISA of serum TNP-specific or total IgM and IgG3 (d7) from Mtor +/+ Cd21 cre/+ or Mtor fl/fl Cd21 cre/+ mice following i.p. immunization with TNP-Ficoll. e RT-PCRs of mRNAs for AID (Aicda), Iµ-Cµ, Iγ3-Cγ3, and GAPDH (Gapdh) in splenic resting B cells from Mtor fl/fl Cd21 cre/+ or Mtor +/+ Cd21 cre/+ mice treated for 3 days with APRIL in the presence or absence of LPS. Results are normalized to mRNA for Gapdh and quantified as relative expression (RE) compared to B cells from control Mtor +/+ Cd21 cre/+ mice. f ELISA of total IgG3 secreted by splenic resting CD43 B cells from Mtor +/+ Cd21 cre/+ or Mtor fl/fl Cd21 cre/+ mice treated for 5 days with or without APRIL combined or not with LPS. g FCM of viable B220CD138+ plasmablasts and PCs generated by splenic resting CD43 B cells from Mtor +/+ Cd21 cre/+ or Mtor fl/fl Cd21 cre/+ mice following stimulation as in f. h qRT-PCRs of mRNAs for AID (Aicda), XBP-1 (Xbp1), and BLIMP-1 (Prdm1) in splenic resting CD43 B cells from Mtor +/+ Cd21 cre/+ or Mtor fl/fl Cd21 cre/+ treated as in f. Results are normalized to mRNA for Gapdh and presented as RE compared to B cells from control Mtor fl/fl Cd21 cre/+ mice. i Frequency of viable splenic resting CD43 B cells cultured as in f. Data summarize at least two experiments with at least two animals in each experimental group (ag) and show one representative replicate (e, g). Error bars, s.e.m.; *p < 0.05, **p < 0.01, ***p < 0.001 (two-tailed Student’s t test)

References

    1. Cerutti A, Cols M, Puga I. Marginal zone B cells: virtues of innate-like antibody-producing lymphocytes. Nat. Rev. Immunol. 2013;13:118–132. doi: 10.1038/nri3383. - DOI - PMC - PubMed
    1. Mackay F, Schneider P. Cracking the BAFF code. Nat. Rev. Immunol. 2009;9:491–502. doi: 10.1038/nri2572. - DOI - PubMed
    1. Balázs M, Martin F, Zhou T, Kearney JF. Blood dendritic cells interact with splenic marginal zone B cells to initiate T-independent immune responses. Immunity. 2002;17:341–352. doi: 10.1016/S1074-7613(02)00389-8. - DOI - PubMed
    1. He B, et al. The transmembrane activator TACI triggers immunoglobulin class switching by activating B cells through the adaptor MyD88. Nat. Immunol. 2010;11:836–845. doi: 10.1038/ni.1914. - DOI - PMC - PubMed
    1. Figgett WA, et al. The TACI receptor regulates T-cell-independent marginal zone B cell responses through innate activation-induced cell death. Immunity. 2013;39:573–583. doi: 10.1016/j.immuni.2013.05.019. - DOI - PubMed

Publication types

MeSH terms