. 2017 Nov 13;8(1):1467.
doi: 10.1038/s41467-017-01629-7.

Regulation of angiotensin II actions by enhancers and super-enhancers in vascular smooth muscle cells

Affiliations

Regulation of angiotensin II actions by enhancers and super-enhancers in vascular smooth muscle cells

Sadhan Das et al. Nat Commun. .

Abstract

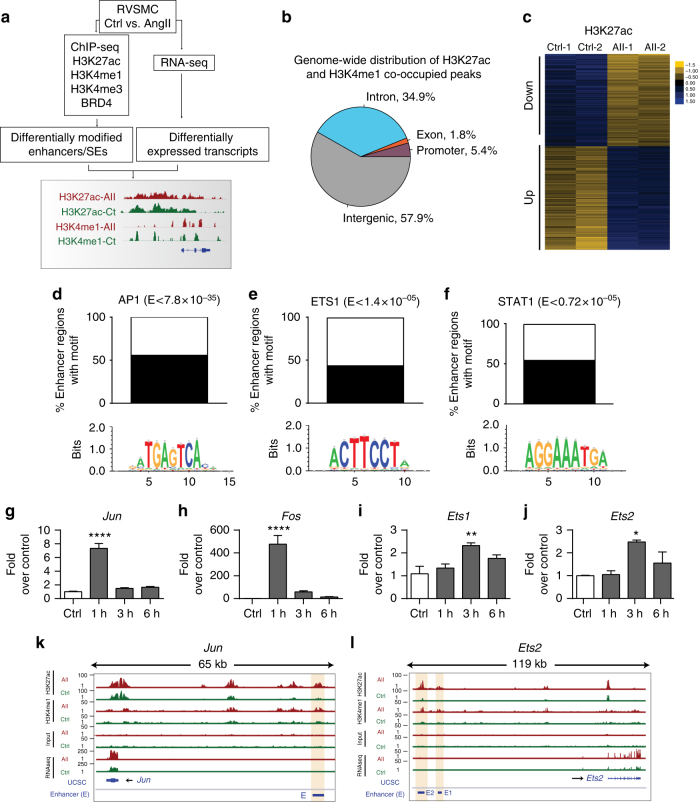
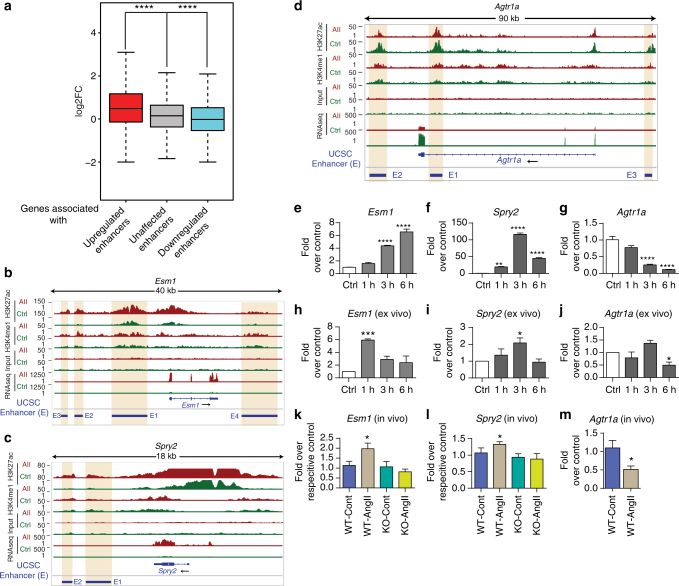
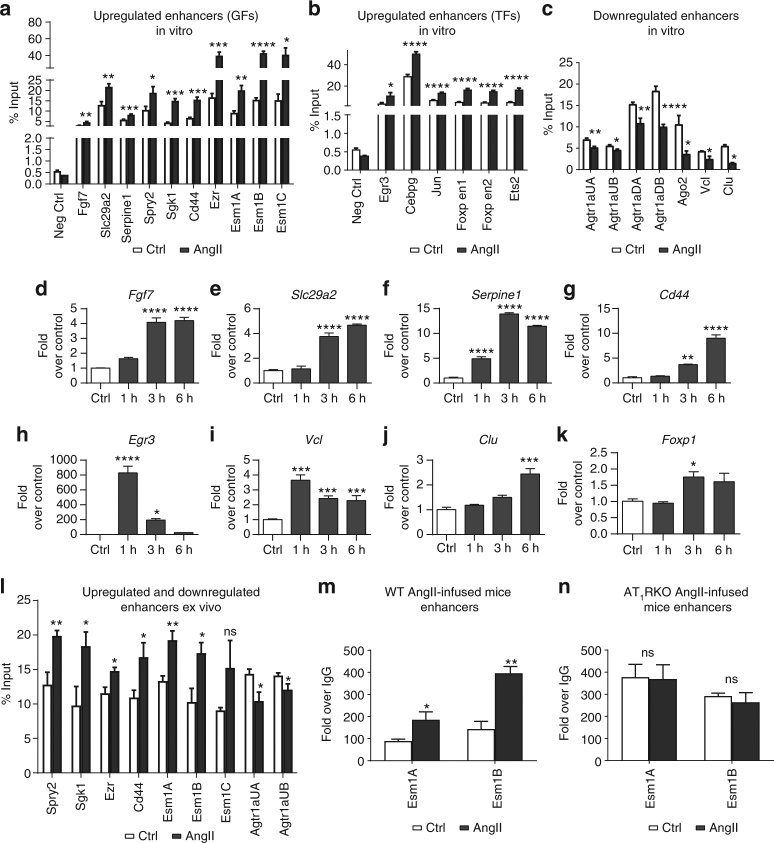
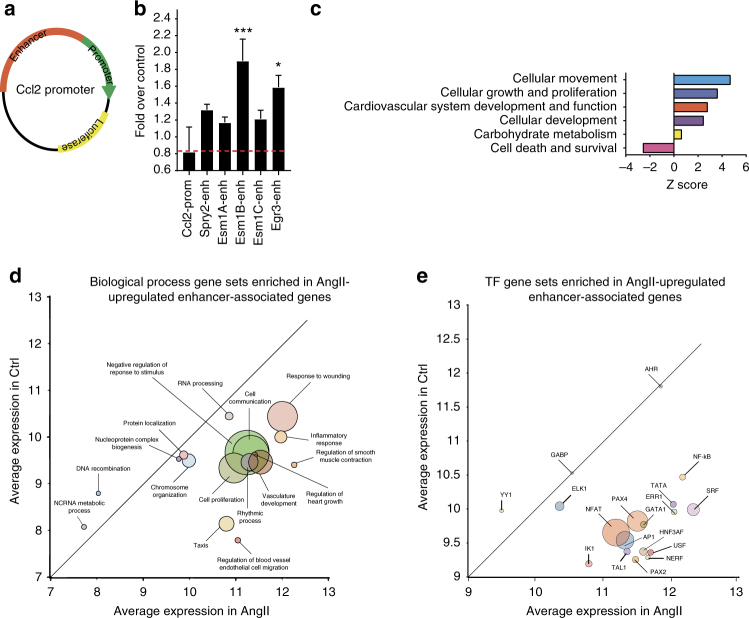
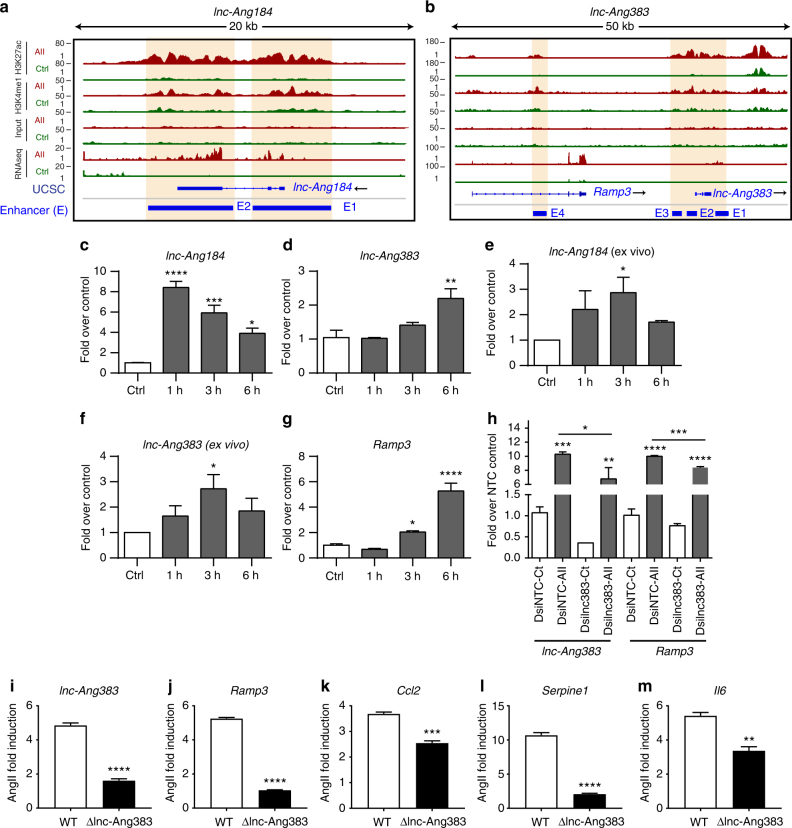
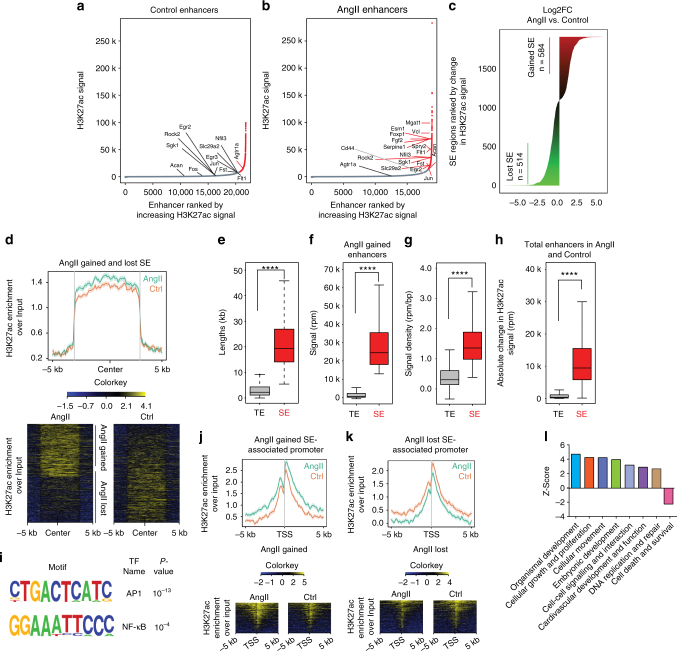
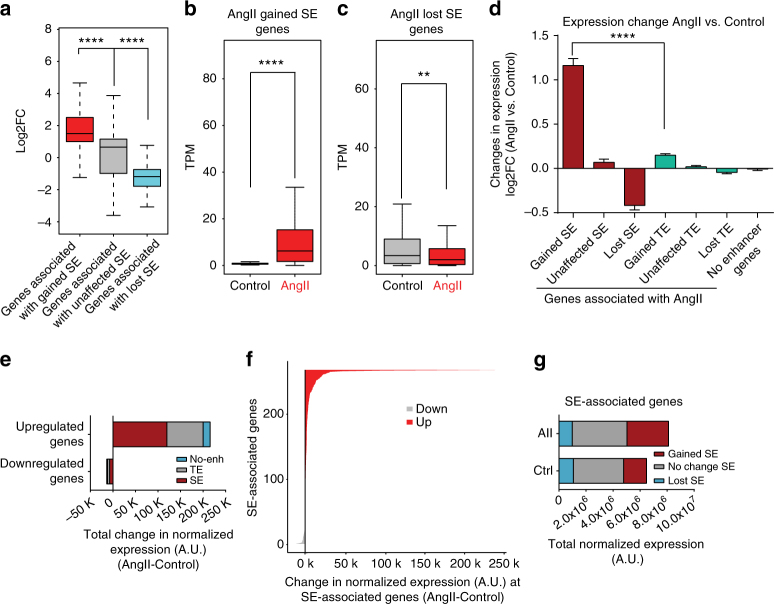
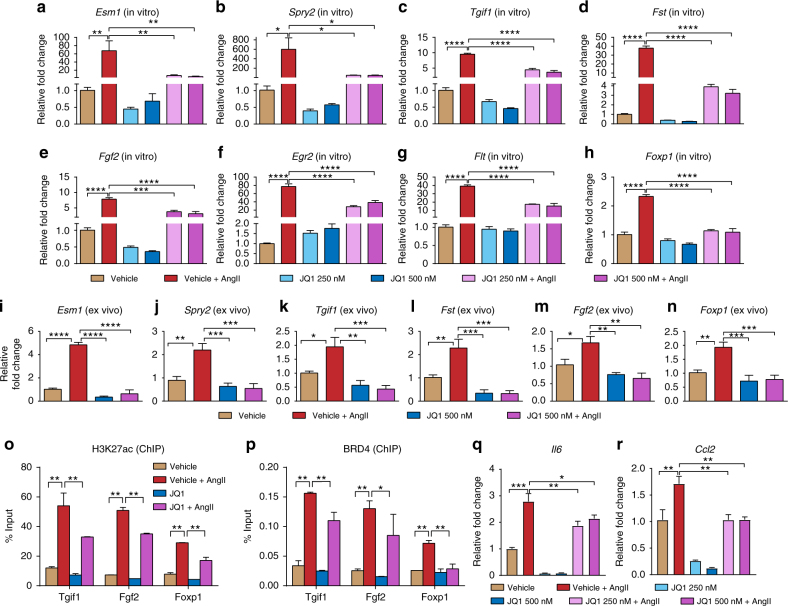
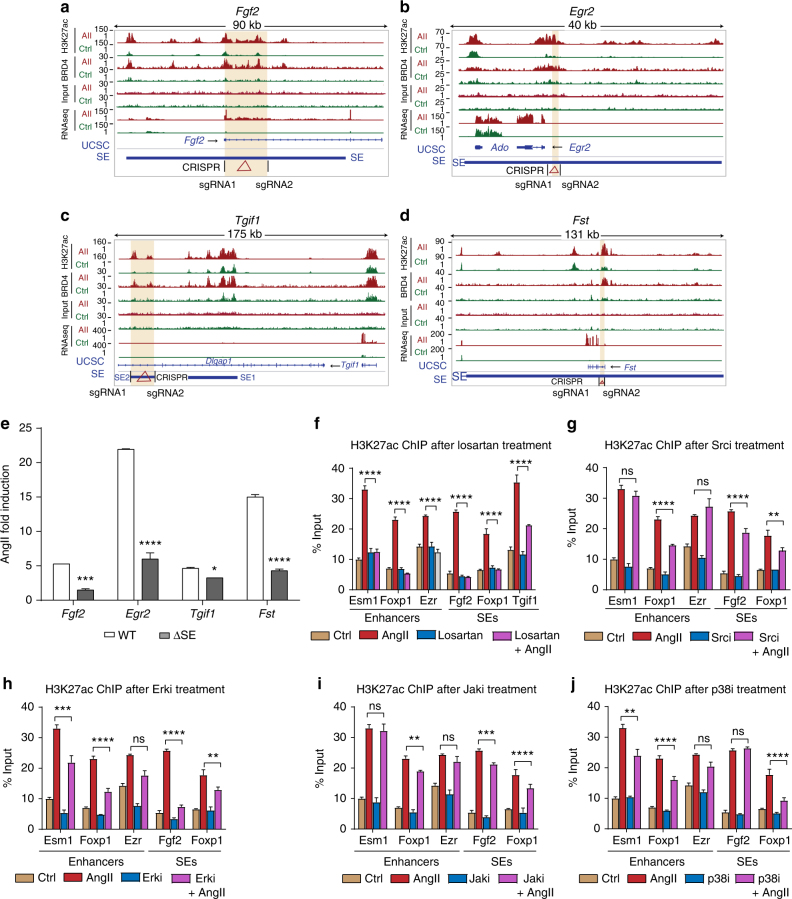
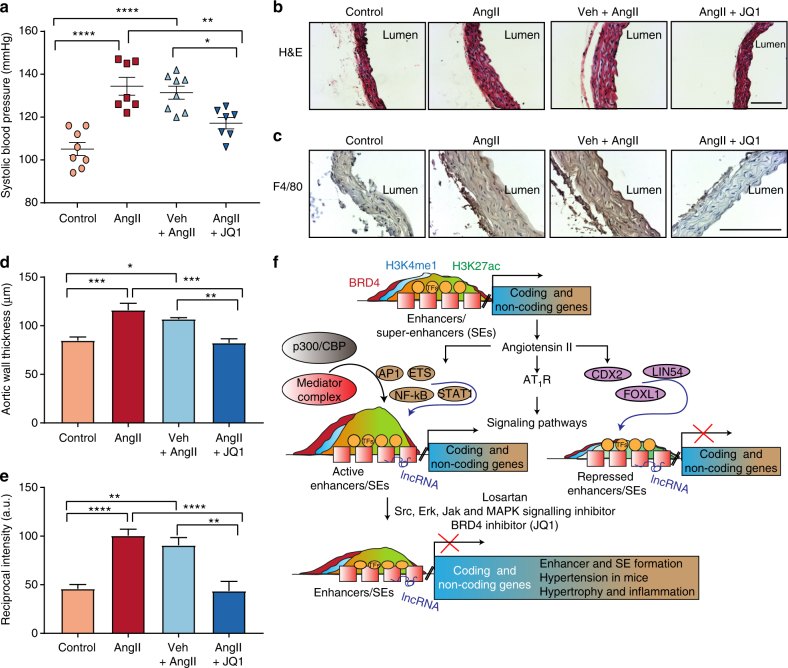
Angiotensin II (AngII) promotes hypertension and atherosclerosis by activating growth-promoting and pro-inflammatory gene expression in vascular smooth muscle cells (VSMCs). Enhancers and super-enhancers (SEs) play critical roles in driving disease-associated gene expression. However, enhancers/SEs mediating VSMC dysfunction remain uncharacterized. Here, we show that AngII alters vascular enhancer and SE repertoires in cultured VSMCs in vitro, ex vivo, and in AngII-infused mice aortas in vivo. AngII-induced enhancers/SEs are enriched in binding sites for signal-dependent transcription factors and dependent on key signaling kinases. Moreover, CRISPR-Cas9-mediated deletion of candidate enhancers/SEs, targeting SEs with the bromodomain and extra-terminal domain inhibitor JQ1, or knockdown of overlapping long noncoding RNAs (lncRNAs) blocks AngII-induced genes associated with growth-factor signaling and atherosclerosis. Furthermore, JQ1 ameliorates AngII-induced hypertension, medial hypertrophy and inflammation in vivo in mice. These results demonstrate AngII-induced signals integrate enhancers/SEs and lncRNAs to increase expression of genes involved in VSMC dysfunction, and could uncover novel therapies.


Conflict of interest statement

The authors declare no competing financial interests.

Figures

Fig. 1
Fig. 1
AngII-regulated TFs involved in VSMC enhancer repertoire. a Schematic depicts strategy employed to identify AngII-induced enhancers and SEs in RVSMCs using high-throughput ChIP-seq and RNA-seq data. b Genomic distribution of co-occupied H3K27ac and H3K4me1-enriched regions. c Heatmaps showing the differential enrichment of H3K27ac at enhancers (1541 upregulated and 1328 downregulated) in Control (Ctrl) and AngII (AII)-treated RVSMCs compared to 5201 unaffected enhancers (fold change ≤ 1.05). H3K27ac enrichment in form of log2 ChIP vs. input across four samples (as indicated on top of the column) were mean centered at each enhancer and visualized by heatmap with yellow indicating below average and blue above average. df Bar graphs showing percentage of upregulated enhancers enriched with indicated signal-dependent TF binding motifs after AngII treatment (H3K27ac increased by ≥2 fold, q < 0.05). E is Bonferroni-adjusted P-value. gj Bar graphs represent changes in mRNA levels of indicated TFs upon AngII treatment (1–6 h). Gene expression normalized to Ppia is expressed as Fold over control. Mean + SEM, *P < 0.05; **P < 0.01; ****P < 0.0001, n = 3. Significance was calculated using one-way ANOVA, Dunnett’s multiple comparisons test comparing the means of each time point to the mean of Control (Ctrl). k, l ChIP-seq and RNA-seq tracks showing enhancers for indicated TFs. Blue horizontal bars-enhancers (E), Orange vertical bar-H3K27ac signal
Fig. 2
Fig. 2
AngII-induced enhancers regulate expression of nearby genes. a Box plot showing genes associated with upregulated (red), unaffected (gray), and downregulated (blue) enhancers. ****P < 0.0001, using unpaired two-tailed t-test. bd Profiles of H3K27ac and H3K4me1 signals for VSMC-specific enhancers around nearby differentially expressed genes Esm1 (b), Spry2 (c), and Agtr1a (d). Each data track shown is on the same scale for both Control and AngII samples. Differentially regulated enhancers have been highlighted with vertical orange bars. Blue horizontal bars indicate enhancers (E). eg Bar graphs showing validation of AngII-induced expression of Esm1 (e), Spry2 (f), and Agtr1a (g) in RVSMCs (in vitro). hj Bar graphs showing validation of AngII-induced expression of indicated genes in ex vivo treated rat aortas and km bar graphs showing validation of AngII-induced expression of indicated genes in vivo in aortas from WT or AT1RKO (KO) mice infused with PBS (Cont) or AngII. Gene expression was normalized to Ppia and expressed as Fold over control. Mean + SEM; n = 3 independent experiments (for eg); n = 3 rat aortas (for hj). *P < 0.05; **P < 0.01; ***P < 0.001; ****P < 0.0001, using one-way ANOVA, Dunnett’s multiple comparison. For km, n = 6 mouse aortas, *P < 0.05, using unpaired two-tailed t-test
Fig. 3
Fig. 3
Validation of enhancer regions and expression of AngII-induced nearby genes. a, b Bar graphs represent H3K27ac enrichment at upregulated enhancers near indicated GF signaling (a) and TF (b) genes in Control (Ctrl) or AngII-treated RVSMCs. c H3K27ac enrichment at downregulated enhancers near indicated genes in RVSMCs untreated or treated in vitro with AngII. dk Enhancer-associated nearby gene expression was validated in RVSMCs treated with AngII for 1–6 h in vitro. Gene expression was normalized to Ppia and expressed as Fold over control. Mean + SEM; *P < 0.05; **P < 0.01; ***P < 0.001; ****P < 0.0001 vs. Ctrl; n = 3, using one-way ANOVA, Dunnett’s multiple comparison. l H3K27ac enrichment at upregulated and downregulated enhancers near indicated genes in rat aortas untreated (Ctrl) or treated ex vivo with AngII. m, n H3K27ac enrichment at upregulated enhancers near indicated genes in aortas from vehicle (Ctrl) or AngII-infused WT and AT1RKO mice. H3K27ac enrichment is represented as Percent Input (ac, l) or fold enrichment over IgG (Fold over IgG) pulldown (m, n). For l three rat aortas, and for m, n four mouse aortas were pooled to perform the ChIP assays. ac and ln Mean + SEM; *P < 0.05; **P < 0.01; ***P < 0.001; ****P < 0.0001 vs. Ctrl; n = 3, using unpaired two-tailed t-test
Fig. 4
Fig. 4
AngII-regulated enhancers are associated with VSMC phenotypes. a Schematic for the enhancer reporter construct with firefly luciferase gene under the control of Ccl2 promoter. Potential enhancers (Enhancer) of indicated nearby genes were cloned upstream of the Ccl2 promoter. b RVSMCs were co-transfected with Ccl2 promoter (Ccl2-Prom) or indicated enhancer (enh) reporters and control Renilla luciferase plasmid. RVSMCs were treated ± AngII and firefly luciferase activity normalized with Renilla luciferase was expressed as Fold over control. Mean + SEM; *P < 0.05; ***P < 0.001 vs. control Ccl2-Prom; n = 4, using one-way ANOVA, Dunnett’s multiple comparison. c IPA of nearby genes associated with upregulated enhancers. d GSEA analysis of genes associated with upregulated enhancers. Significant biological process gene sets (empirical P < 0.05) below the diagonal line are upregulated, while those above or on the diagonal line are downregulated. The size of the circle is proportional to the number of significantly altered genes (0.5 < log2FC < −0.5) within that pathway. e Significant TF gene sets (empirical P < 0.05) below the diagonal line are upregulated, while those above or on the diagonal line are downregulated. The size of the circle is proportional to the number of significantly altered genes (0.5 < log2FC < −0.5) within that pathway
Fig. 5
Fig. 5
lncRNAs overlapping enhancers regulate VSMC gene expression. a, b Profiles of H3K27ac and H3K4me1 signals for VSMC-specific enhancers overlapping lncRNAs; lnc-Ang184 and lnc-Ang383. Each data track for control and AngII is shown on the same scale for both Control and AngII. Orange vertical boxes indicate H3K27ac signals at differentially upregulated enhancers. Blue bars represent enhancers (E). cf Bar graphs represent changes in the expression of lnc-Ang184 and lnc-Ang383 in RVSMCs treated in vitro (c, d) and rat aortas treated ex vivo (e, f) with AngII for indicated times. Gene expression was normalized to Ppia. Mean + SEM; n = 3 independent experiments for c, d, and n = 4 rat aortas for e, f; *P < 0.05; **P < 0.01; ***P < 0.001; ****P < 0.0001, using one-way ANOVA, Dunnett’s multiple comparisons test. g RT-qPCR analysis of AngII-induced Ramp3 expression in RVSMCs at indicated times. Gene expression was normalized to Ppia. Mean + SEM; n = 3 independent experiments, *P < 0.05; ****P < 0.0001, using one-way ANOVA, Dunnett’s multiple comparisons test. h Expression of AngII-induced (3 h) lnc-Ang383 and Ramp3 in RVSMCs transfected with DsiRNAs targeting lnc-Ang383 (Dsilnc383) or control DsiNTC. Gene expression was normalized to Ppia and results expressed as fold over siNTC control. Mean + SEM; n = 3 independent experiments, *P < 0.05; **P < 0.01; ***P < 0.001; ****P < 0.0001, using one-way ANOVA, Tukey’s multiple comparisons test. i, j Bar graphs showing AngII-induced expression of lnc-Ang383 and Ramp3 in WT and lnc-Ang383 deleted cells (generated by CRISPR-Cas9 editing). km AngII-induced expression of pro-inflammatory genes Ccl2, Serpine1, and Il6 in RVSMCs with lnc-Ang383 deletion (ΔlncAng-383) and WT cells. Gene expression was normalized to Ppia. Mean + SEM; n = 4 independent experiments, **P < 0.01; ***P < 0.001; ****P < 0.0001, using unpaired two-tailed t-test (im)
Fig. 6
Fig. 6
Characterization of AngII-induced SEs in VSMCs. a, b Ranked plots of enhancers in Control (a) or AngII-treated (b) RVSMCs ranked by increasing H3K27ac signal. Enhancers are defined as overlapping regions of H3K27ac and H3K4me1 and with differential enrichment of H3K27ac. SEs are colored red and TEs are colored in gray. The SE and TE-associated genes are indicated in the figure. c SEs in Control and AngII-treated RVSMCs are shown ranked by log2 fold change in H3K27ac signal (AngII vs. control). The change in H3K27ac levels at SEs is indicated by change in color intensity (green to red). d Average profile and heatmaps of H3K27ac enrichment over AngII gained and lost SEs. eh Boxplots show median enhancer length (kb) (e), signal (rpm) (f), and density (rpm/bp) (g) in AngII gained TEs and SEs. h Boxplot shows the absolute change in H3K27ac signal in response to AngII treatment measured at all SEs in Control and AngII-treated RVSMCs. For eh ****P < 0.0001, using unpaired two-tailed t-test. i TF binding motifs enriched in AngII gained SEs. De novo motif discovery identified AP1 motif to be enriched (P < 10−10, binomial distribution) while NF-κB motif was enriched in known motifs (q < 0.005, Benjamini multiple hypothesis testing). j Average profile and heatmaps of H3K27ac enrichment over promoters of AngII gained and k AngII lost SE-associated genes. l IPA Pathway analysis of genes associated with gained SEs
Fig. 7
Fig. 7
SEs regulate proximal gene expression in response to AngII. a Boxplot shows average log2 fold change in mRNA expression at genes associated with AngII gained, AngII lost, or unaffected SEs. b Boxplot shows TPM of genes associated with SEs that were gained or c lost in response to AngII treatment. **P < 0.01; ****P < 0.0001 (for ac), using unpaired two-tailed t-test. d Bar plot shows average log2 fold change in mRNA expression at genes associated with AngII gained, AngII lost, or unchanged SE, TEs and genes associated with no enhancers. Error bars represent SEM. ****P < 0.0001, using one-way ANOVA, Tukey’s multiple comparisons test. e Stacked bar graph shows the cumulative change in gene expression after AngII treatment at upregulated or downregulated genes (−1 > log2FC > 1). Genes are further categorized based on whether they are associated with SEs, TEs or are not associated with any enhancers. f Plot shows the absolute change in normalized expression (A.U.) post AngII treatment for all SE-associated genes. Genes are sorted by absolute change in expression between AngII-treated and Control cells with red and gray depicting upregulated and downregulated genes, respectively. g Stacked bar graph shows the cumulative expression of genes associated with AngII gained, lost or unchanged SEs in Ctrl and AngII-treated RVSMCs. AngII treatment induced a 25% increase in total normalized expression of SE-associated genes and 21% of this increase was contributed by AngII gained SE-associated genes
Fig. 8
Fig. 8
JQ1 attenuates SE formation and SE-associated gene expression. ah and q, r Bars represent the expression of SE-associated genes or inflammatory genes measured by RT-qPCR in RVSMCs pre-treated with vehicle or BRD4 inhibitor JQ1 (250 and 500 nM) and then treated in vitro with AngII as indicated. in Bars represent the expression of indicated SE-associated genes in rat aortas pretreated ex vivo with vehicle or JQ1 (500 nM) followed by AngII treatment. Gene expression was normalized with Ppia and represented as relative fold change with respect to vehicle. Mean + SEM, n = 3. For in (n = 4 aortas). *P < 0.05; **P < 0.01; ***P < 0.001; ****P < 0.0001, using one-way ANOVA, Tukey’s multiple comparisons test. o, p ChIP assays. Bars represent H3K27ac (o) and BRD4 (p) ChIP enrichment on the indicated SE regions in RVSMCs untreated or treated with either AngII, JQ1, or both in vitro. Data are represented as Mean + SEM, n = 3. *P < 0.05; **P < 0.01, using one-way ANOVA, Tukey’s multiple comparisons test
Fig. 9
Fig. 9
SE deletion blocks the expression of corresponding nearby genes. ad Genome browser tracks showing the relative position of the indicated SEs (highlighted in orange) with respect to nearby indicated gene and the position of the sgRNAs (denoted by black lines) designed to delete the SE using CRISPR-Cas9 editing; a Fgf2, b Egr2, c Tgif1, d Fst. e Bar graphs show the AngII-induced expression of indicated genes in WT and SE deleted (∆SE) RVSMCs mutants. Gene expression was normalized to Ppia and expressed as AngII response vs. respective Controls. Mean + SEM, n = 3. *P < 0.05; ***P < 0.001; ****P < 0.0001, using unpaired two-tailed t-test. fj Signaling mechanisms involved in AngII-induced regulation of enhancers/SEs in VSMCs. Bars represent H3K27ac enrichment (ChIP assays) on the indicated enhancer and SE regions in control (Ctrl) or AngII-stimulated RVSMCs pretreated with or without inhibitors (i) of AT1R (Losartan), Src (PP1), Erk1/2 (U0126), Jak (Inhibitor 1), and p38MAPK (SB202190). Data are represented as Mean + SEM, n = 3. **P < 0.01; ***P < 0.001; ****P < 0.0001; ns non-significant, using one-way ANOVA, Tukey’s multiple comparisons test
Fig. 10
Fig. 10
JQ1 ameliorates hypertension, hypertrophy and inflammation in AngII-infused mice. C57BL/6 mice were infused with PBS (Control) or AngII and AngII-infused mice were also treated with vehicle (Veh + AngII) or JQ1 (AngII + JQ1) for 4 weeks. a Scatter plot showing systolic blood pressure (mmHg) of mice from indicated groups. Data are represented as Mean + SEM, n = 7 for AngII and AngII + JQ1 groups, n = 8 for Control (PBS) and Veh + AngII groups. *P < 0.05; **P < 0.01; ****P < 0.0001, using one-way ANOVA, Tukey’s multiple comparisons test. b Representative images of H&E staining in mouse aortas from indicated groups. 10× magnification, scale bar 150 µm. c Representative images of F4/80 staining in mouse aortas from indicated groups. 20× magnification, scale bar 150 µm. d, e Quantification of b and c (as described in Methods). Data are represented as Mean + SEM, *P < 0.05; **P < 0.01; ***P < 0.001; ****P < 0.0001, using one-way ANOVA, Tukey’s multiple comparisons test. f Scheme depicting AngII-induced epigenetic changes at enhancers/SEs leading to remodeling and altered gene regulation. Unstimulated VSMCs maintain basal levels of gene expression that are associated with enhancers/SEs with minimum or moderate H3K4me1, H3K27ac, and BRD4 signals. These enhancers/SEs may be occupied by a limited number of TFs. AngII stimulation and subsequent downstream signaling possibly leads to increased recruitment of TFs such as AP1, ETS, STAT1 and NF-κB at their respective binding sites on the enhancers/SEs that further recruit BRD4, the mediator complex, and p300/CBP leading to increased H3K27ac enrichment and SE formation thereby enhancing the transcription of nearby genes. Moreover, AngII stimulation could also recruit other TFs such as CDX2, FOXL1 and LIN54 and through an unknown mechanism may lead to a loss of H3K27ac enrichment on the enhancer to downregulate the associated genes. Enhancer-associated lncRNAs might be intimately linked to both these processes and may play a crucial role in AngII-induced gene expression in VSMCs. Blocking AngII signaling by the AT1R blocker losartan or inhibitors of downstream signaling pathways attenuates AngII-induced enhancer/SE formation. Moreover, blocking SEs using a BRD4 inhibitor JQ1 ameliorates AngII-induced hypertension in mice

Similar articles

Cited by

References

    1. Brasier AR, Recinos A, 3rd, Eledrisi MS. Vascular inflammation and the renin-angiotensin system. Arterioscler. Thromb. Vasc. Biol. 2002;22:1257–1266. doi: 10.1161/01.ATV.0000021412.56621.A2. - DOI - PubMed
    1. Mehta PK, Griendling KK. Angiotensin II cell signaling: physiological and pathological effects in the cardiovascular system. Am. J. Physiol. Cell Physiol. 2007;292:C82–C97. doi: 10.1152/ajpcell.00287.2006. - DOI - PubMed
    1. Itoh H, Mukoyama M, Pratt RE, Gibbons GH, Dzau VJ. Multiple autocrine growth-factors modulate vascular smooth-muscle cell-growth response to angiotensin-Ii. J. Clin. Invest. 1993;91:2268–2274. doi: 10.1172/JCI116454. - DOI - PMC - PubMed
    1. Cao ZM, Cooper ME. Efficacy of renin-angiotensin system (RAS) blockers on cardiovascular and renal outcomes in patients with type 2 diabetes. Acta Diabetol. 2012;49:243–254. doi: 10.1007/s00592-011-0328-3. - DOI - PubMed
    1. Sahar S, et al. Angiotensin II enhances interleukin-18 mediated inflammatory gene expression in vascular smooth muscle cells: a novel cross-talk in the pathogenesis of atherosclerosis. Circ. Res. 2005;96:1064–1071. doi: 10.1161/01.RES.0000168210.10358.f4. - DOI - PubMed

Publication types

MeSH terms