Comparative Study
. 2017 Nov 13;7(1):15454.
doi: 10.1038/s41598-017-15685-y.

Comparison and evaluation of two different methods to establish the cigarette smoke exposure mouse model of COPD

Affiliations
Comparative Study

Comparison and evaluation of two different methods to establish the cigarette smoke exposure mouse model of COPD

Jiaze Shu et al. Sci Rep. .

Abstract

Animal model of cigarette smoke (CS) -induced chronic obstructive pulmonary disease (COPD) is the primary testing methodology for drug therapies and studies on pathogenic mechanisms of disease. However, researchers have rarely run simultaneous or side-by-side tests of whole-body and nose-only CS exposure in building their mouse models of COPD. We compared and evaluated these two different methods of CS exposure, plus airway Lipopolysaccharides (LPS) inhalation, in building our COPD mouse model. Compared with the control group, CS exposed mice showed significant increased inspiratory resistance, functional residual capacity, right ventricular hypertrophy index, and total cell count in BALF. Moreover, histological staining exhibited goblet cell hyperplasia, lung inflammation, thickening of smooth muscle layer on bronchia, and lung angiogenesis in both methods of CS exposure. Our data indicated that a viable mouse model of COPD can be established by combining the results from whole-body CS exposure, nose-only CS exposure, and airway LPS inhalation testing. However, in our study, we also found that, given the same amount of particulate intake, changes in right ventricular pressure and intimal thickening of pulmonary small artery are a little more serious in nose-only CS exposure method than changes in the whole-body CS exposure method.


Conflict of interest statement

The authors declare that they have no competing interests.

Figures

Figure 1
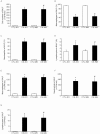
Figure 1
Lung function measurement, including FRC (A), Chord compliance (B), inspiratory resistance (C), FEV50/FVC (D) and FEV100/FVC (E), following the group of nose-only CS exposure (CS-NO) or air control (CTL-NO) and the group of whole-body CS exposure (CS-WB) or air control (CTL-WB). Data are presented as mean ± SD (n = 6–9), *P < 0.01 for CS-NO group vs. CTL-NO group, # P < 0.01 for CS-WB group vs. CTL-WB group.
Figure 2
Figure 2
Number of total cells in BALF (A), the proportion of macrophages (B), neutrophils (C) and lymphocytes (D), the number of macrophages (E), neutrophils (F) and lymphocytes (G) in the total BALF cells, following the group of nose-only CS exposure (CS-NO) or air control (CTL-NO) and the group of whole-body CS exposure (CS-WB) or air control (CTL-WB). Data are presented as mean ± SD (n = 6–9), *P < 0.01 for CS-NO group vs. CTL-NO group, # P < 0.01 for CS-WB group vs. CTL-WB group.
Figure 3
Figure 3
The protein levels of IL6 (A) and KC (B) in BALF, following the group of nose-only CS exposure (CS-NO) or air control (CTL-NO) and the group of whole-body CS exposure (CS-WB) or air control (CTL-WB). Data are presented as mean ± SD (n = 6–9), *P < 0.01 for CS-NO group vs. CTL-NO group, # P < 0.01 for CS-WB group vs. CTL-WB group.
Figure 4
Figure 4
Right ventricular pressure and hypertrophy index, including representative traces of right ventricular pressure of each group of animals (A), right ventricular systolic pressure (B) and right ventricular hypertrophy index (C), following the group of nose-only CS exposure (CS-NO) or air control (CTL-NO) and the group of whole-body CS exposure (CS-WB) or air control (CTL-WB). Data are presented as mean ± SD (n = 6–9), *P < 0.01 for CS-NO group vs. CTL-NO group, # P < 0.01 for CS-WB group vs. CTL-WB group, & P < 0.05 for CS-NO group vs. CS-WB group.
Figure 5
Figure 5
Representative light micrographs of lung tissues of mice (A) and the mean linear intercept (B), following the group of nose-only CS exposure (CS-NO) or air control (CTL-NO) and the group of whole-body CS exposure (CS-WB) or air control (CTL-WB). Scale bar = 100 μm. Data are presented as mean ± SD (n = 5), *P < 0.01 for CS-NO group vs. CTL-NO group, # P < 0.01 for CS-WB group vs. CTL-WB group.
Figure 6
Figure 6
Representative light micrographs of bronchiole of mice (A) and the bronchial wall area (B) and the bronchial wall thickness (C), following the group of nose-only CS exposure (CS-NO) or air control (CTL-NO) and the group of whole-body CS exposure (CS-WB) or air control (CTL-WB). Scale bar = 100 μm. Data are presented as mean ± SD (n = 5), *P < 0.01 for CS-NO group vs. CTL-NO group, # P < 0.01 for CS-WB group vs. CTL-WB group.
Figure 7
Figure 7
The PAS staining (A) and the Masson’s trichrome staining (B), the PAS positive staining area of epithelium (C) and the ratio of collagen area/total brochial area (D), following the group of nose-only CS exposure (CS-NO) or air control (CTL-NO) and the group of whole-body CS exposure (CS-WB) or air control (CTL-WB). Scale bar = 100 μm. Data are presented as mean ± SD (n = 5), *P < 0.01 for CS-NO group vs. CTL-NO group, # P < 0.01 for CS-WB group vs. CTL-WB group.
Figure 8
Figure 8
Representative light micrographs of distal small vessels of mouse’s lung (A) and the α-SMA staining (B), the vessel wall area (C), and the vessel wall thickness (D), following the group of nose-only CS exposure (CS-NO) or air control (CTL-NO) and the group of whole-body CS exposure (CS-WB) or air control (CTL-WB). Scale bar = 50 μm. Data are presented as mean ± SD (n = 5), *P < 0.01 for CS-NO group vs. CTL-NO group, # P < 0.01 for CS-WB group vs. CTL-WB group, & P < 0.05 for CS-NO group vs. CS-WB group.
Figure 9
Figure 9
The level of determination of hematocrit index (A) and the level of D-dimer in plasma (B), following the group of nose-only CS exposure (CS-NO) or air control (CTL-NO) and the group of whole-body CS exposure (CS-WB) or air control (CTL-WB). Data are presented as mean ± SD (n = 6–9), *P < 0.01 for CS-NO group vs. CTL-NO group, # P < 0.01 for CS-WB group vs. CTL-WB group, & P < 0.05 for CS-NO group vs. CS-WB group.

References

    1. Global strategy for the diagnosis, management, and prevention of chronic obstructive pulmonary disease January 2015; Available from: http://www.goldcopd.org (Updated 2015).
    1. Kohansal R, et al. The natural history of chronic airflow obstruction revisited: an analysis of the Framingham offspring cohort. Am J Respir Crit Care Med. 2009;180:3–10. doi: 10.1164/rccm.200901-0047OC. - DOI - PubMed
    1. Doi M, Nakano K, Hiramoto T, Kohno N. Significance of pulmonary artery pressure in emphysema patients with mild-to-moderate hypoxemia. Respir Med. 2003;97:915–920. doi: 10.1016/S0954-6111(03)00115-X. - DOI - PubMed
    1. Peinado VI, Pizarro S, Barbera JA. Pulmonary vascular involvement in COPD. Chest. 2008;134:808–814. doi: 10.1378/chest.08-0820. - DOI - PubMed
    1. Chaouat A, Naeije R, Weitzenblum E. Pulmonary hypertension in COPD. Eur Respir J. 2008;32:1371–1385. doi: 10.1183/09031936.00015608. - DOI - PubMed

Publication types

MeSH terms