

doi: 10.1038/s41598-017-14828-5.
A real-time Global Warming Index
Affiliations
- PMID: 29133863
- PMCID: PMC5684339
- DOI: 10.1038/s41598-017-14828-5
Item in Clipboard
A real-time Global Warming Index
Sci Rep.
.
Abstract
We propose a simple real-time index of global human-induced warming and assess its robustness to uncertainties in climate forcing and short-term climate fluctuations. This index provides improved scientific context for temperature stabilisation targets and has the potential to decrease the volatility of climate policy. We quantify uncertainties arising from temperature observations, climate radiative forcings, internal variability and the model response. Our index and the associated rate of human-induced warming is compatible with a range of other more sophisticated methods to estimate the human contribution to observed global temperature change.
Conflict of interest statement
The authors declare that they have no competing interests.
Figures
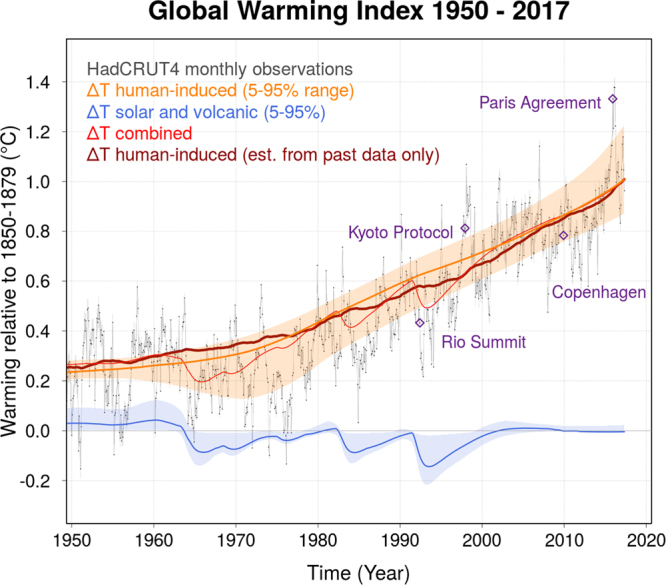
Global Warming Index from Jan 1950 to May 2017 for HadCRUT4. The anthropogenic contribution in orange (with 5–95% confidence interval). The natural contribution (solar and volcanic) in blue. The red line shows the combined (total) externally-driven temperature change. The dark red line shows the evolution of the GWI when only past forcing and temperature data are used. It starts in 1944 - the time when a human-induced warming signal can first be detected - followed by a new data point for each month up until May 2017. The evolution of the red line indicates the degree of month-to-month variability of the index. The thin black line are the monthly (HadCRUT4) GMST data. For illustration, blue diamonds indicate when major climate summits took place in context of the monthly GMST at that time.
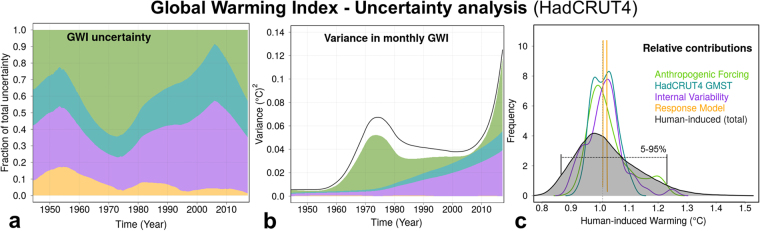
GWI uncertainty analysis for HadCRUT4. (a) Temporal evolution (1950–2017) of fraction contributions to the total uncertainty (5–95% range). (b) Same as (a) but for the variance (square of the standard error). The black line is the combined total variance. This differs from the sum because uncertainties are non-gaussian. Note the very small contribution of the response model uncertainty at the bottom. (c) Probability density function for the relative uncertainty contributions to the value of the GWI in May 2017. Note that the response model frequency peaks at ~100. In black is the PDF of the combined total uncertainty.
References
-
- Otto A, et al. Energy budget constraints on climate response. Nature Geoscience Correspondance. 2013;6:415–416. doi: 10.1038/ngeo1836. - DOI
-
- Stocker, T. et al. Technical summary. In Climate Change 2013: The Physical Science Basis. Contribution of Working Group I to the Fifth Assessment Report of the Intergovernmental Panel on Climate Change (Cambridge University Press, Cambridge, United Kingdom and New York, NY, USA, 2013).
-
- Huber M, Knutti R. Natural variability, radiative forcing and climate response in the recent hiatus reconciled. Nature Geoscience. 2014;7:651–656. doi: 10.1038/ngeo2228. - DOI
-
- Schmidt G, Shindell D, Tsigaridis K. Reconciling warming trends. Nature Geoscience. 2014;7:158–160. doi: 10.1038/ngeo2105. - DOI
-
- Marvel K, Schmidt G, Miller R, Nazarenko L. Implications for climate sensitivity from the response to individual forcings. Nature Climate Change. 2016;6:386–389. doi: 10.1038/nclimate2888. - DOI
LinkOut - more resources
Full Text Sources
Other Literature Sources
