. 2017 Nov 13;7(1):15376.
doi: 10.1038/s41598-017-15612-1.

Effects of microgravity on osteoblast mitochondria: a proteomic and metabolomics profile

Affiliations

Effects of microgravity on osteoblast mitochondria: a proteomic and metabolomics profile

Anna Michaletti et al. Sci Rep. .

Abstract

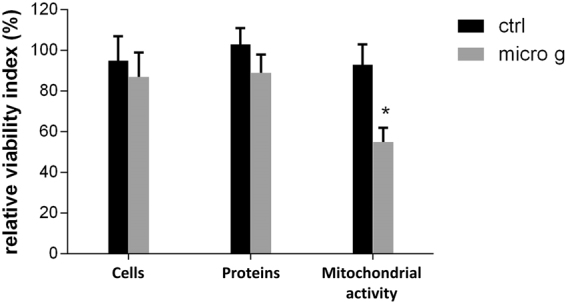
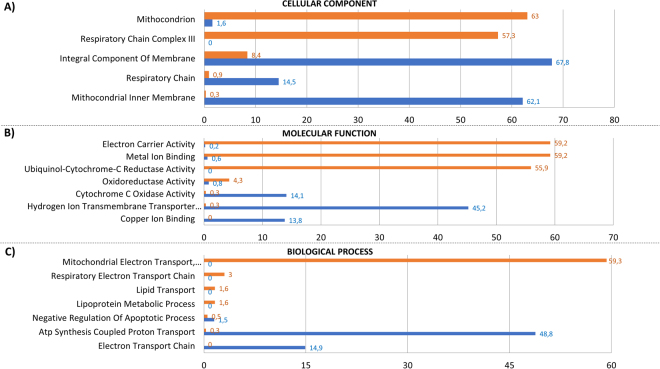
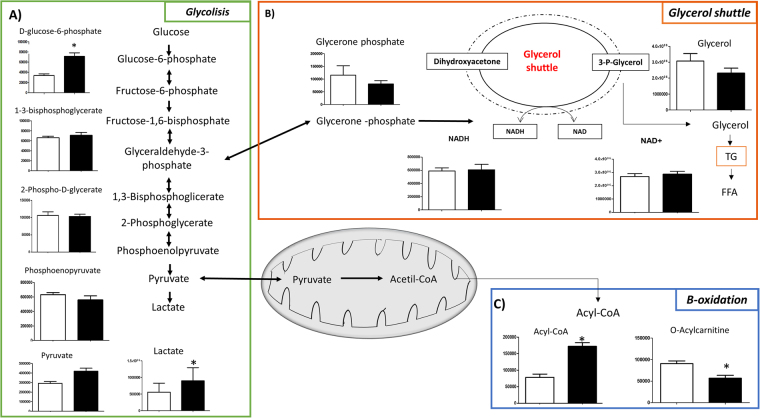
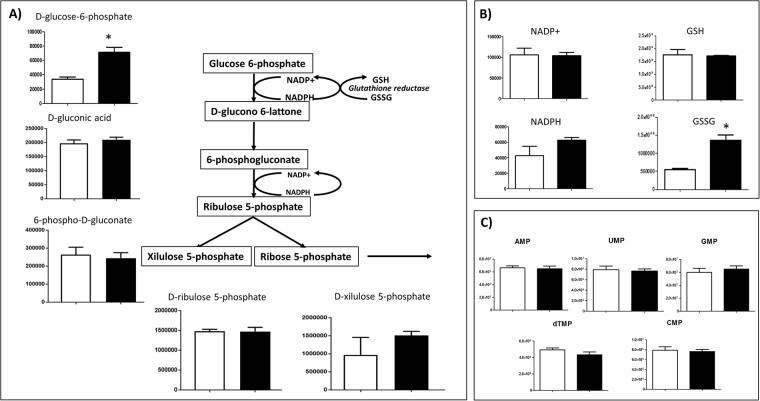
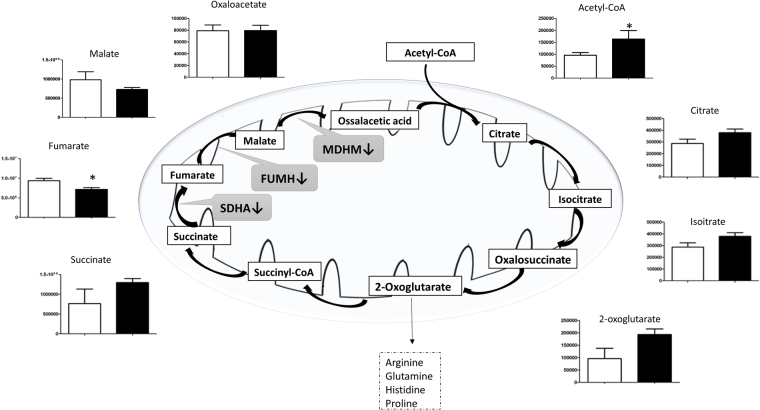
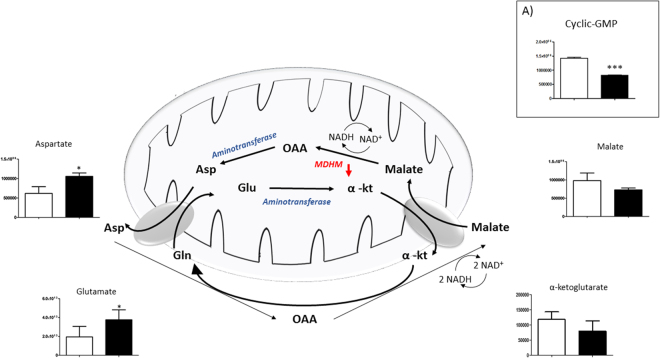
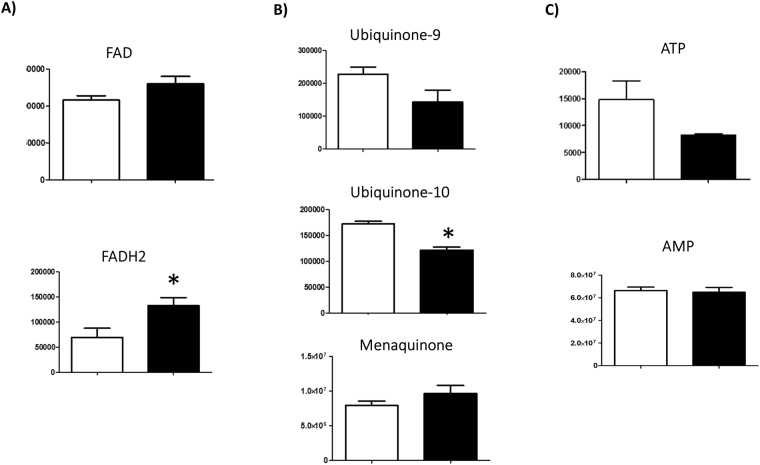
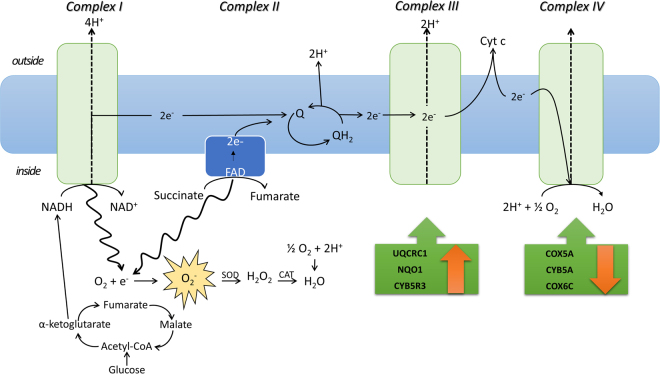
The response of human primary osteoblasts exposed to simulated microgravity has been investigated and analysis of metabolomic and proteomic profiles demonstrated a prominent dysregulation of mitochondrion homeostasis. Gravitational unloading treatment induced a decrease in mitochondrial proteins, mainly affecting efficiency of the respiratory chain. Metabolomic analysis revealed that microgravity influenced several metabolic pathways; stimulating glycolysis and the pentose phosphate pathways, while the Krebs cycle was interrupted at succinate-fumarate transformation. Interestingly, proteomic analysis revealed that Complex II of the mitochondrial respiratory chain, which catalyses the biotransformation of this step, was under-represented by 50%. Accordingly, down-regulation of quinones 9 and 10 was measured. Complex III resulted in up-regulation by 60%, while Complex IV was down-regulated by 14%, accompanied by a reduction in proton transport synthesis of ATP. Finally, microgravity treatment induced an oxidative stress response, indicated by significant decreases in oxidised glutathione and antioxidant enzymes. Decrease in malate dehydrogenase induced a reverse in the malate-aspartate shuttle, contributing to dysregulation of ATP synthesis. Beta-oxidation of fatty acids was inhibited, promoting triglyceride production along with a reduction in the glycerol shuttle. Taken together, our findings suggest that microgravity may suppress bone cell functions, impairing mitochondrial energy potential and the energy state of the cell.


Conflict of interest statement

The authors declare that they have no competing interests.

Figures

Figure 1
Figure 1
Effect of microgravity on viability of hpOB cells. The relative effect of microgravity treatment was expressed as relative cell viability index. The results were expressed as a percentage of: i) number of cells with intact plasma membrane (trypan blue impermeable cells), ii) cell protein content (BCA absorbance), and iii) metabolically active cells (MTS absorbance). Histograms represent mean ± SD (n = 6), black columns refer to control samples, whereas grey columns represent 110 hours-microgravity-exposed cells. Statistical significance was determined busing Student’s t-test. Significant decrease relative to respective control values at p < 0.05 is denoted as *.
Figure 2
Figure 2
Functional enrichment analysis of hpOB under Normogravity and Microgravity using FunRich. Bioinformatics Gene Ontology-based classification of proteomes according to three categories: cellular component (A), molecular function (B), and biological process (C). Numbers next to the bars represent levels of normogravity (blue bars) and microgravity (orange bars), respectively. Only categories with >2-fold change are shown.
Figure 3
Figure 3
Metabolic cross-talk among glycolysis, glycerol shuttle and β-oxidation pathways. Variation in the levels of metabolic intermediates of: (A) glycolysis, (B) glycerol shuttle and (C) two intermediates of β-oxidation. Values represent mean ± SD (n = 9) of normogravity (white columns) and microgravity (black columns) metabolites. Statistical significance was indicated by *p < 0.05; **p < 0.01; ***p < 0.001.
Figure 4
Figure 4
Intermediates of PPP pathway. Variation in the levels of metabolic intermediates in PPP cycle. Panel (A) represents NADP/ NADPH and GSH/GSSG. Panel (B) represents nucleotide monophosphate. Values are mean ± SD (n = 9) of normogravity (white columns) and microgravity (black columns) metabolites. Statistical significance was indicated by *p < 0.05; **p < 0.01; ***p < 0.001.
Figure 5
Figure 5
Intermediates of tricarboxylic acid pathway (TCA). Variation in the levels of metabolic intermediates in Kreb’s cycle. It was interrupted at succinate production with a decrease in fumarate and malate levels, and down-regulation of FUMH, MDHM and succinate dehydrogenase enzymes (black arrow). Values are mean ± SD (n = 9) of normogravity (white columns) and microgravity (black columns) metabolites. Statistical significance was indicated by *p < 0.05; **p < 0.01; ***p < 0.001.
Figure 6
Figure 6
Intermediates of Malate-Aspartate Shuttle. Variation in the levels of metabolic intermediates of the malate-aspartate shuttle. Down-regulation of MDHM enzyme is represented by red arrow. Panel 6 (A) show the decrease of Cyclic-GMP. Values are mean ± SD (n = 9) of normogravity (white columns) and microgravity (black columns) metabolites. Statistical significance was indicated by *p < 0.05; **p < 0.01; ***p < 0.001. (OAA = Oxalacetate; Asp = Aspartate; Glu = Glutamate; α-kt = α-ketoglutarate).
Figure 7
Figure 7
Cellular levels of FAD, Quinones, ATP. Variation in the levels of metabolic intermediates in (A) FAD/FADH2, (B) ubiquinone 9, ubiquinone 10 and menachinone, (C) ATP and AMP. Values are mean ± SD (n = 9) of normogravity (white columns) and microgravity (black columns) metabolites. Statistical significance was indicated by *p < 0.05; **p < 0.01; ***p < 0.001.
Figure 8
Figure 8
Crosstalk between TCA cycle and Mitochondrial electron transport chain in microgravity. Succinate accumulation shows toxic effect of reactive oxygen species from mitochondrial electron transport chain. An unbalanced proton pump could be associated with FADH2 accumulation. Green boxes show enzymes’ trend (statistical significance is shown in Table 1).

References

    1. Ikawa T, et al. Hypergravity suppresses bone resorption in ovariectomized rats. Adv Space Res. 2011;47:1214–1224. doi: 10.1016/j.asr.2010.12.004. - DOI
    1. Xue JH, et al. Differential regulation and recovery of intracellular Ca2 + in cerebral and small mesenteric arterial smooth muscle cells of simulated microgravity rat. PloS one. 2011;6(5):e19775. doi: 10.1371/journal.pone.0019775. - DOI - PMC - PubMed
    1. Lee SG, et al. A load of mice to hypergravity causes AMPKα repression with liver injury, which is overcome by preconditioning loads via Nrf2. Sci Rep. 2015;5:15643. doi: 10.1038/srep15643. - DOI - PMC - PubMed
    1. Ciofani G, et al. Hypergravity effects on myoblast proliferation and differentiation. J. Biosci. Bioeng. 2012;113:258–261. doi: 10.1016/j.jbiosc.2011.09.025. - DOI - PubMed
    1. Genchi GG, et al. Hypergravity stimulation enhances PC12 neuron-like cell differentiation. Biomed Res Int. 2015;2015:748121. doi: 10.1155/2015/748121. - DOI - PMC - PubMed

Publication types

Substances

LinkOut - more resources