. 2017 Nov 13;7(1):15386.
doi: 10.1038/s41598-017-13071-2.

Eph-B4 regulates adaptive venous remodeling to improve arteriovenous fistula patency

Affiliations

Eph-B4 regulates adaptive venous remodeling to improve arteriovenous fistula patency

Clinton D Protack et al. Sci Rep. .

Abstract

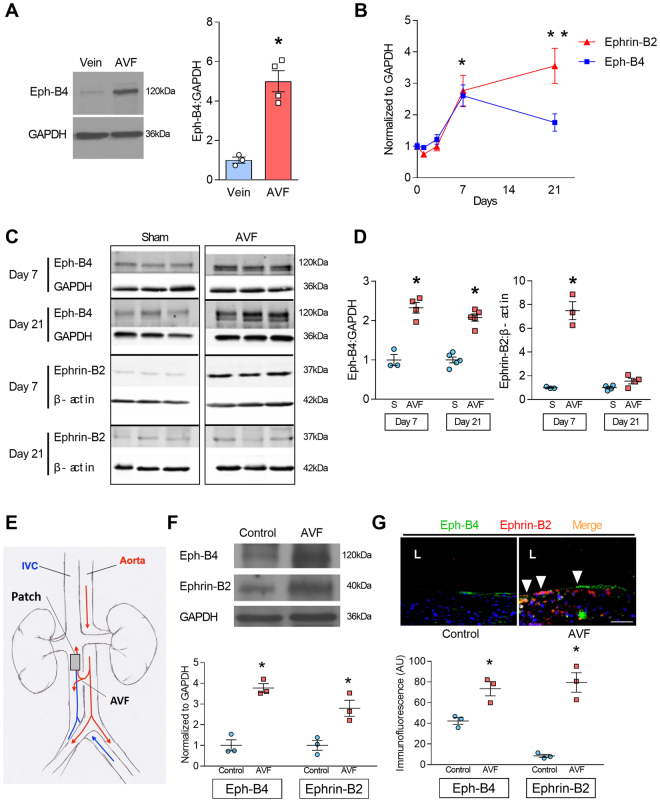
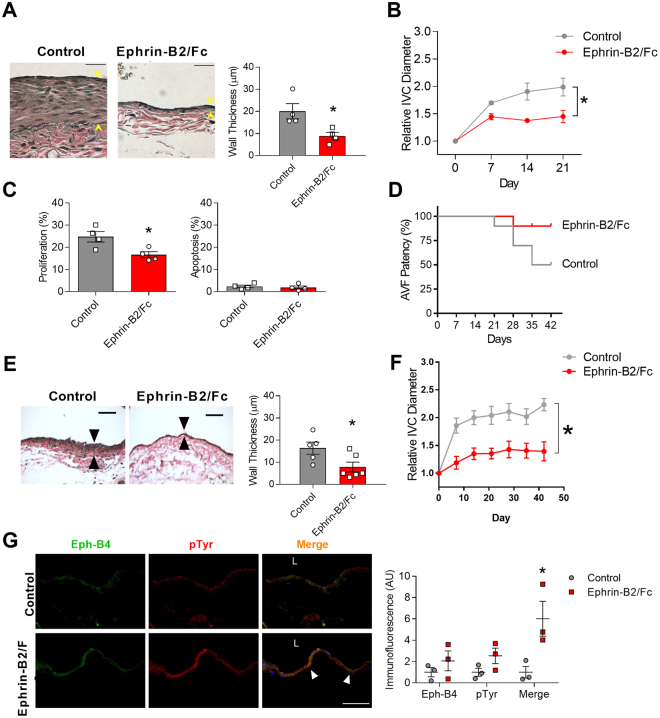
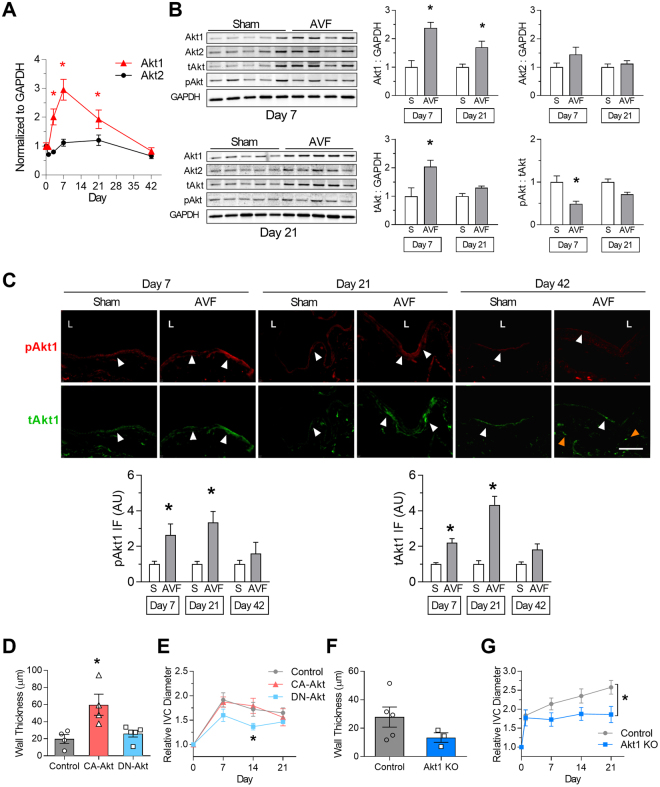
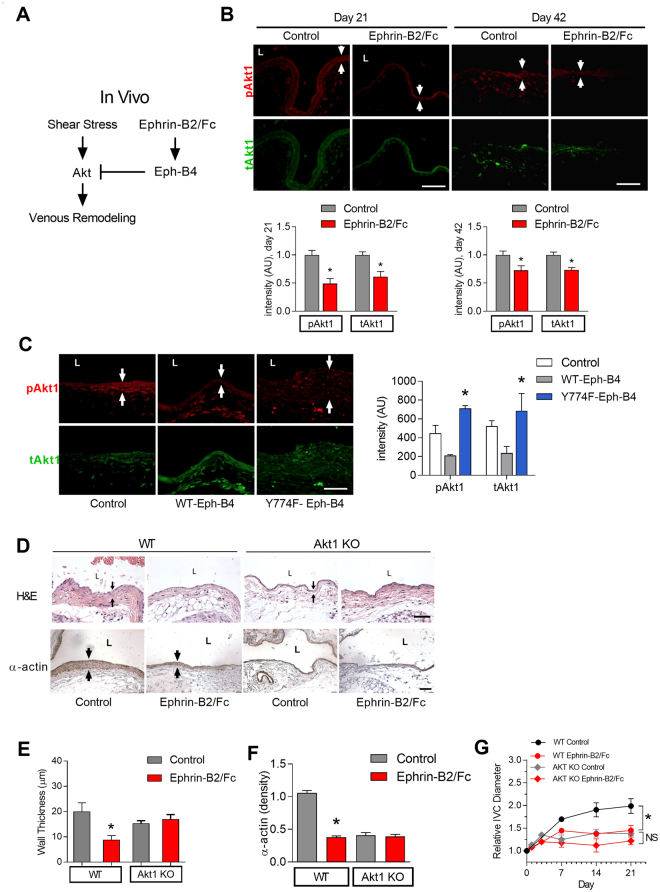
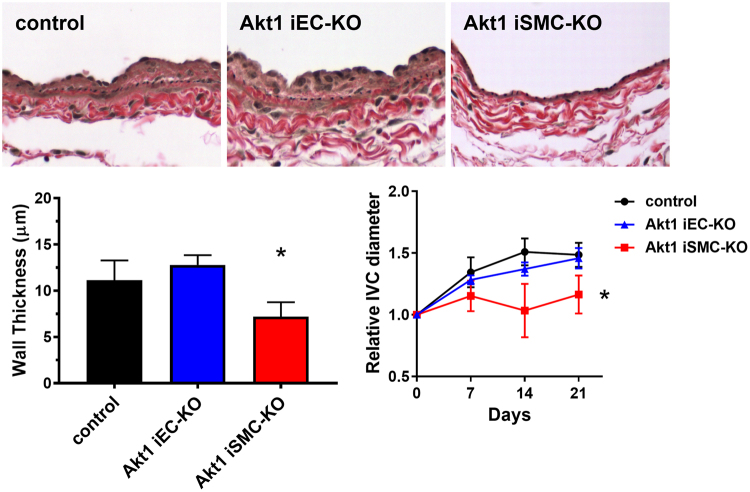
Low rates of arteriovenous fistula (AVF) maturation prevent optimal fistula use for hemodialysis; however, the mechanism of venous remodeling in the fistula environment is not well understood. We hypothesized that the embryonic venous determinant Eph-B4 mediates AVF maturation. In human AVF and a mouse aortocaval fistula model, Eph-B4 protein expression increased in the fistula vein; expression of the arterial determinant Ephrin-B2 also increased. Stimulation of Eph-B-mediated signaling with Ephrin-B2/Fc showed improved fistula patency with less wall thickness. Mutagenesis studies showed that tyrosine-774 is critical for Eph-B4 signaling and administration of inactive Eph-B4-Y774F increased fistula wall thickness. Akt1 expression also increased in AVF; Akt1 knockout mice showed reduced fistula diameter and wall thickness. In Akt1 knockout mice, stimulation of Eph-B signaling with Ephrin-B2/Fc showed no effect on remodeling. These results show that AVF maturation is associated with acquisition of dual arteriovenous identity; increased Eph-B activity improves AVF patency. Inhibition of Akt1 function abolishes Eph-B-mediated venous remodeling suggesting that Eph-B4 regulates AVF venous adaptation through an Akt1-mediated mechanism.


Conflict of interest statement

The authors declare that they have no competing interests.

Figures

Figure 1
Figure 1
Increased Eph-B4 and Ephrin-B2 expression during adaptive venous remodeling. (A) Western blot and adjacent bar graph of densitometry showing human Eph-B4 expression in AVF venous limb compared to normal vein. *P = 0.0016; t-test. n = 3–4. (B) Line graphs show expression of Eph-B4 (blue) and Ephrin-B2 (red) in the AVF venous limb compared to sham IVC; P < 0.0001 (ANOVA). *P < 0.05 (P = 0.0123, Eph-B4; P = 0.0041, Ephrin-B2; post hoc); **P < 0.05 (P < 0.0001, Ephrin-B2; post hoc). n = 5–8. (C) Western blots showing Eph-B4 and Ephrin-B2 protein expression in AVF venous limb compared to sham IVC. n = 3–5. (D) Graphs showing densitometry of Eph-B4 (left panel) and Ephrin-B2 (right panel) expression in the AVF venous limb compared to sham IVC; *P < 0.05 (P < 0.0001, Eph-B4 day 7, AVF vs sham; P < 0.0001, Eph-B4 day 21, AVF vs sham; P < 0.0001, Ephrin-B2 day 7, AVF vs sham; post hoc). n = 3–5. (E) Diagram of rat model showing location of infrarenal IVC pericardial patch exposed to an aortocaval AVF (n = 6 per group). (F) Representative Western blot (upper panel) showing Eph-B4 and Ephrin-B2 expression in patch neointima (day 14) of control vein compared to patch neointima of AVF vein. Graphs (lower panel) show quantification of western blot bands; P < 0.0001 (ANOVA). *P < 0.05 (P = 0.0003, Eph-B4; P = 0.0043, Ephrin-B2; post hoc). n = 3. (G) Representative photomicrographs (upper panel) showing Eph-B4 (green) and Ephrin-B2 (red) immunoreactive signal (day 14). White arrowheads indicate colocalization of Eph-B4 and Ephrin-B2. L, vessel lumen. Graph (lower panel) shows quantification of immunoreactive signal; P < 0.0001 (ANOVA). *P < 0.05 (P = 0.0136 Eph-B4; P < 0.0001 Ephrin-B2; post hoc). n = 3. Scale bar 100 µm. Data represent mean ± SEM.
Figure 2
Figure 2
Activation of Eph-B4 regulates venous remodeling. (A) Representative photomicrographs (left panel) and bar graph (right panel) showing AVF venous wall thickness in AVF treated with control or Ephrin-B2/Fc (day 21); *P = 0.03 (t-test). n = 4. Scale bar, 25 µm. (B) Line graph showing IVC diameter in mice treated with control or Ephrin-B2/Fc; *P < 0.0001 (ANOVA). n = 4–5. (C) Bar graphs showing percentage of cells in the AVF positive for proliferation (Ki67) or apoptosis (cleaved caspase-3) (day 21); *P = 0.02 (t-test). n = 4. (D) Line graph showing AVF patency in mice treated with control or Ephrin-B2/Fc injections. P = 0.05 (Chi-square); P = 0.06 (Log-rank), n = 10. (E) Representative photomicrographs (left panel) and bar graph (right panel) showing AVF venous wall thickness in AVF treated with control or Ephrin-B2/Fc (day 42); *P = 0.04 (t-test). n = 5–6. Scale bar, 50 µm. (F) Line graph showing IVC diameter in mice treated with control or Ephrin-B2/Fc; *P < 0.0001 (ANOVA). n = 13–14. (G) Representative photomicrographs (left panel) and graph (right panel) showing Eph-B4 (green), phosphotyrosine (pTyr; red), and merged (yellow) immunoreactive signal with control (top row) or Ephrin-B2/Fc (bottom row) (day 21). Yellow arrowheads indicate merged signal. P = 0.0042 (ANOVA). *P = 0.0052 (post hoc). n = 3. Scale bar, 100 µm. Data represent mean ± SEM.
Figure 3
Figure 3
Reduced Eph-B4 activity increases venous neointimal thickening. (A) Representative photomicrographs (left panel) and bar graph (right panel) showing AVF venous limb wall thickness in control and Eph-B4 het mice (day 21); *P = 0.047 (t-test). n = 8. Scale bar 25 µm. (B) Line graph showing infrarenal IVC diameter in control or Eph-B4 het mice; *P = 0.59 (ANOVA). n = 8–9. (C) Representative Western blot showing inhibited tyrosine phosphorylation in the Y774F-Eph-B4 mutant compared to the WT-Eph-B4 construct (0–60 min). (D) Bar graph showing Ephrin-B2/Fc stimulated COS cell migration after transfection with WT-Eph-B4 or Y774F-Eph-B4 plasmids. P < 0.0001 (ANOVA); *P < 0.0001 Ephrin-B2/Fc WT-Eph-B4 vs Y774F-Eph-B4. n = 3–4. (E) Representative photomicrographs (left panel) showing AVF venous wall (elastin stain) in control mice or mice treated with WT-Eph-B4 or mutant Y774F-Eph-B4. Arrow heads denote neointimal thickness. Scale bar, 25 µm. Bar graph (right panel) showing quantification of AVF venous wall thickness in control mice (white bar) or mice treated with WT-Eph-B4 (gray bar) or mutant Y774F-Eph-B4 (blue bar), day 21; P = 0.035 (ANOVA). *P = 0.038 (WT-Eph-B4 vs Y774F-Eph-B4; post hoc). n = 5–7. (F) Line graph showing infrarenal IVC diameter in mice with AVF treated with WT-Eph-B4 (gray line) or mutant Y774F-Eph-B4 (purple line) compared to control (black line); *P = 0.005 (ANOVA). n = 5–11. Data represent mean ± SEM.
Figure 4
Figure 4
Eph-B4 signaling is mediated by Akt1 in vitro. (A) Diagram showing in vitro Eph-B4 and downstream signaling under static conditions. (B) Representative Western blot showing Ephrin-B2/Fc stimulation of Akt1, eNOS, and ERK1/2 phosphorylation in EC derived from WT or Akt1 KO mice (0–60 min). (C) Bar graphs show quantification of Western blot comparing EC derived from WT or Akt1 KO mice. pAkt1; P < 0.0001 (ANOVA). *P < 0.05 (post hoc). peNOS; P < 0.0001 (ANOVA). *P < 0.05 (post hoc). pERK1/2; P < 0.0001 (ANOVA). *P < 0.05 (post hoc). n = 3. (D) Representative photomicrographs showing immunoreactive signal to Eph-B4 (green), pAkt1 (red), and merge (yellow) in WT (top and middle row) or Akt1 KO (bottom row) EC without or with Ephrin-B2/Fc. White arrow indicates merged signal. Scale bar, 25 µm. (E) Bar graph showing NO release in WT or Akt1 KO EC stimulated with Ephrin-B2/Fc or FBS; P < 0.0001 (ANOVA). *P < 0.05 (P = 0.0108 WT Ephrin-B2/Fc vs control; P = 0.0035 WT FBS vs control; post hoc). (F) Representative immunofluorescence showing pAkt1 (green), tAkt1 (red), and merged (yellow) signal from WT EC under static (top row; 0 dyne/cm2) or flow conditions (bottom row; 20 dyne/cm2) without (upper panel) and with the Eph-B4 inhibitor NVP-BHG712 (lower panel). White arrowheads indicates colocalized immunoreactivity. (G) Western blot (upper panel) and accompanying bar graph (lower panel) showing pAkt1 expression stimulated by laminar shear stress, without and with pretreatment with the Eph-B4 inhibitor NVP-BHG712; P < 0.0001 (ANOVA). *P = 0.0018 (post hoc); **P = 0.0003 (post hoc); n = 3. (H) Western blot (upper panel) and accompanying bar graph (lower panel) showing pAkt1 expression stimulated by laminar shear stress, without and with pretreatment with the Ephrin-B2/Fc; P = 0.0094 (ANOVA). *P = 0.0083 (post hoc); n = 2. Data represent mean ± SEM.
Figure 5
Figure 5
Akt1 mediates venous remodeling in vivo. (A) Line graph showing Akt1 and Akt2 mRNA expression in venous limb of AVF; P < 0.0001 (ANOVA). *P < 0.05 (P = 0.0127 at day 3; P < 0.0001 at day 7; P = 0.0289 at day 21; post hoc). n = 7–8. (B) Representative Western blots (left hand panels) showing Akt1, Akt2, tAkt, and pAkt expression in sham veins and venous limb of AVF. Bar graphs (right hand panels) show quantification. Akt1: P < 0.0001 (ANOVA). *P < 0.05 (P = 0.0005 at day 7; P = 0.0415 at day 21; post hoc). Akt2: P = 0.08 (ANOVA). tAkt: P = 0.0032 (ANOVA). *P < 0.05 (P = 0.0039 at day 7; post hoc). pAkt:tAkt ratio: P = 0.0007 (ANOVA). *P < 0.05 (P = 0.0041 at day 7; post hoc). n = 4–5. (C) Representative immunofluorescence (upper panels) showing pAkt1 (red) and tAkt1 (green) signal in sham veins or AVF, day 7 (left columns), day 21 (middle columns), or day 42 (right columns). White arrowheads denote positive signals in endothelium; orange arrowheads denote positive signals in subintima. L = vessel lumen. Bar graphs (lower panel) show quantification of immunoreactive signal. pAkt1; P = 0.0030 (ANOVA). *P < 0.05 (P = 0.0422 at day 7; P = 0.0339 at day 21; post hoc). tAkt1; P < 0.0001 (ANOVA). *P < 0.05 (P = 0.0214 at day 7; P = 0.0002 at day 21; post hoc). n = 3–4. Scale bar, 100 µm. (D) Bar graph showing AVF venous limb wall thickness in WT mice treated with control adenovirus (gray bar), CA-Akt adenovirus (red bar), or DN-Akt adenovirus (blue bar) (day 21); P = 0.0095 (ANOVA). *P < 0.05 (P = 0.0121 CA-Akt vs control; P = 0.0232 CA-Akt vs DN-Akt; post hoc). n = 4–5. (E) Line graph showing infrarenal IVC diameter in WT mice treated with control adenovirus (gray line), CA-Akt adenovirus (red line), or DN-Akt adenovirus (blue line); P = 0.0068 (ANOVA). *P < 0.05 (P = 0.0458 at day 14, DN-Akt vs control; P = 0.0138 at day 14, DN-Akt vs CA-Akt; post hoc). n = 4–5. (F) Bar graph showing AVF wall thickness in WT and Akt1 KO mice (day 21); P = 0.19 (t test). n = 3–5. (G) Line graph showing infrarenal IVC diameter in WT (gray) and Akt1 KO mice (blue); *P = 0.0012 (ANOVA). n = 8–14. Data represent mean ± SEM.
Figure 6
Figure 6
Eph-B4-mediated venous remodeling depends on Akt1. (A) Diagram showing in vivo Eph-B4 signaling inhibits shear stress activation of Akt to inhibit AVF wall thickening. (B) Representative immunofluorescence (upper panels) showing pAkt1 (red) or tAkt (green) in the AVF of WT mice treated with control or Ephrin-B2/Fc (day 21, left panel; day 42, right panel). White arrows show the AVF wall. Scale bar, 100 µm. Bar graphs (lower panel) show quantification. pAkt1; *P = 0.0013 at day 21, P = 0.0343 at day 42 (t-test). tAkt1; *P = 0.0180 at day 21, P = 0.0022 at day 42 (t-test). n = 3 for day 21; n = 5–7 for day 42. (C) Representative immunofluorescence (left panel) showing pAkt1 (red) or tAkt1 (green) in the AVF of WT mice treated with wild type Eph-B4 lentivirus (WT-Eph-B4) or mutant Y774F-Eph-B4 lentivirus (Y774F-Eph-B4) compared to control mice (day 21). Scale bar, 100 µm. Bar graph (right panel) shows quantification. P < 0.0001 (ANOVA). *P < 0.05 (P = 0.0051 pAkt1 WT-Eph-B4 vs Y774F-Eph-B4; P = 0.010 tAkt1 WT-Eph-B4 vs Y774F-Eph-B4; post hoc). n = 3. (D) Photomicrographs showing H&E staining (top row) and immunohistochemistry for α-actin (bottom row) in the wall of WT (first 2 columns) and Akt1 KO mice (last 2 columns) without and with Ephrin-B2/Fc treatment (day 21). Black arrows show the AVF wall. L = vessel lumen. Scale bar, 50 µm. (E) Bar graph showing AVF venous limb wall thickness in WT and Akt KO mice without and with Ephrin-B2/Fc stimulation (day 21); P = 0.0318 (ANOVA). *P = 0.0234 (WT control vs Ephrin-B2/Fc; post hoc). n = 3–4. (F) Bar graph showing quantification of α-actin density in the wall of AVF in WT and Akt1 KO mice without or with Ephrin-B2/Fc (day 21); P < 0.0001 (ANOVA). *P < 0.0001 (WT control vs Ephrin-B2/Fc; post hoc). n = 3. (G) Line graph showing infrarenal IVC diameter in WT and Akt1 KO mice without or with Ephrin-B2/Fc; *P < 0.0001 (ANOVA, WT); NS, P = 0.137 (ANOVA, Akt1 KO). n = 3–5. Data represent mean ± SEM.
Figure 7
Figure 7
Venous remodeling depends on smooth muscle cell Akt1. (A) Representative photomicrographs showing the venous wall (day 21) after AVF creation in control, Akt1 iEC-KO, and Akt1 iSMC-KO mice. (B) Bar graph of AVF wall thickness. *P = 0.0146 compared to Akt1 iEC-KO, t-test. N = 8 for control; N = 6 for Akt1 iEC-KO; N = 4 for Akt1 iSMC-KO. (C) Relative diameter of the AVF over time after AVF creation in control, Akt1 iEC-KO, and Akt1 iSMC-KO mice. *P = 0.0046, ANOVA. N = 9 for control; N = 5 for Akt1 iEC-KO; N = 5 for Akt1 iSMC-KO.

Similar articles

Cited by

References

    1. Dember LM, et al. Effect of clopidogrel on early failure of arteriovenous fistulas for hemodialysis: a randomized controlled trial. JAMA. 2008;299:2164–2171. doi: 10.1001/jama.299.18.2164. - DOI - PMC - PubMed
    1. Gibson KD, et al. Vascular access survival and incidence of revisions: a comparison of prosthetic grafts, simple autogenous fistulas, and venous transposition fistulas from the United States Renal Data System Dialysis Morbidity and Mortality Study. J Vasc Surg. 2001;34:694–700. doi: 10.1067/mva.2001.117890. - DOI - PubMed
    1. Rooijens PP, et al. Radiocephalic wrist arteriovenous fistula for hemodialysis: meta-analysis indicates a high primary failure rate. Eur J Vasc Endovasc Surg. 2004;28:583–589. doi: 10.1016/j.ejvs.2004.08.014. - DOI - PubMed
    1. Besarab A, Ravani P, Spergel LM, Roy-Chaudhury P, Asif A. The native arteriovenous fistula in 2007. Research needs. J Nephrol. 2007;20:668–673. - PubMed
    1. Owens CD, et al. Early biomechanical changes in lower extremity vein grafts–distinct temporal phases of remodeling and wall stiffness. J Vasc Surg. 2006;44:740–746. doi: 10.1016/j.jvs.2006.06.005. - DOI - PubMed

Publication types