. 2017 Nov 14;8(1):1481.
doi: 10.1038/s41467-017-01791-y.

Time-resolved diffraction of shock-released SiO2 and diaplectic glass formation

Affiliations

Time-resolved diffraction of shock-released SiO2 and diaplectic glass formation

A E Gleason et al. Nat Commun. .

Abstract

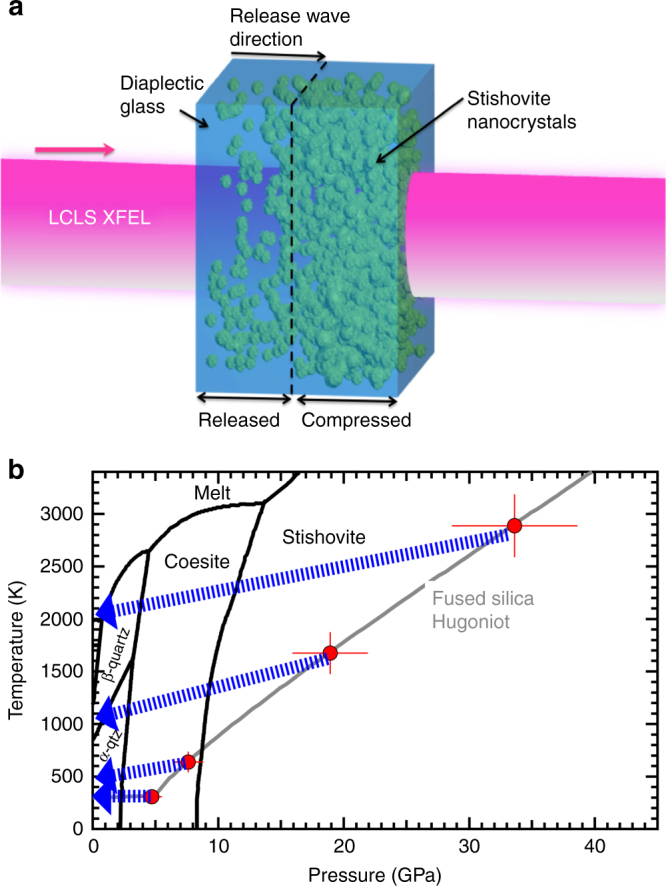
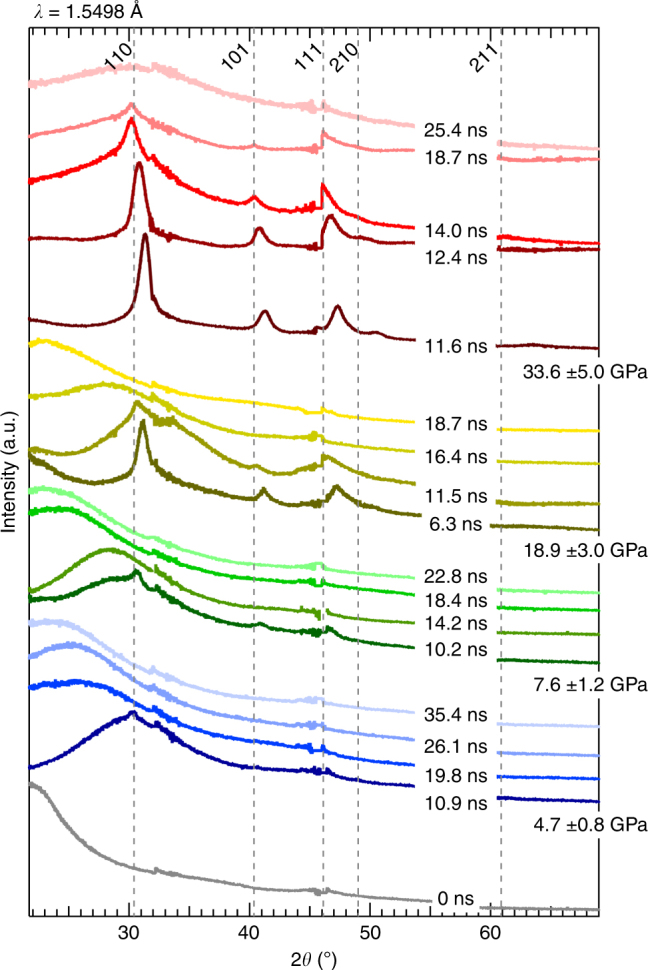
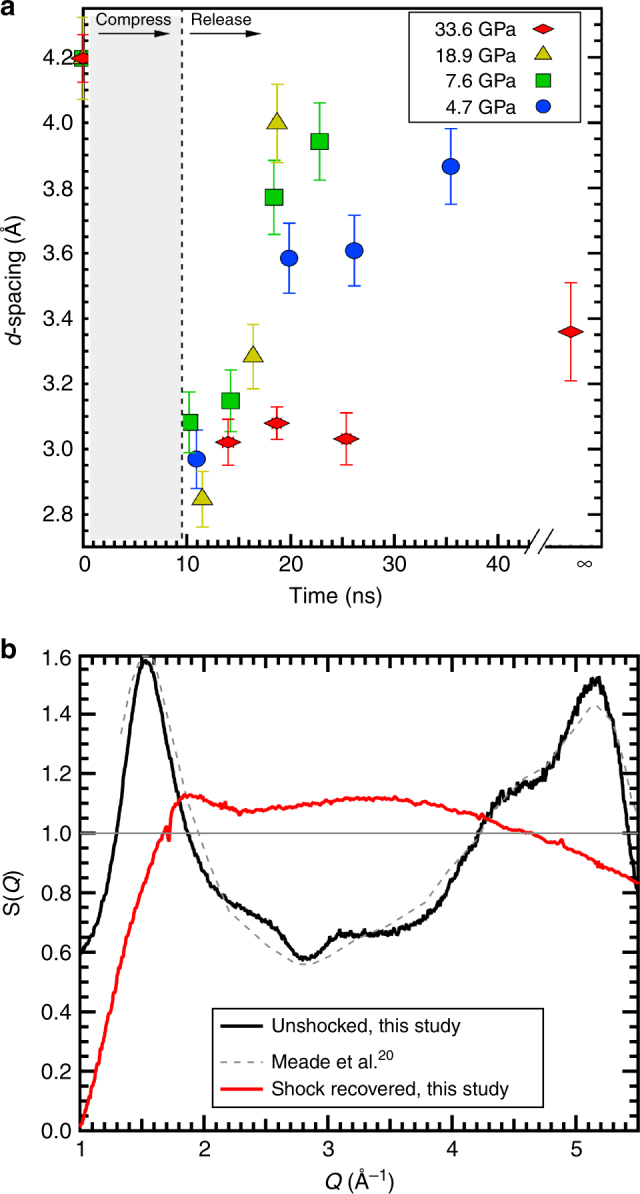
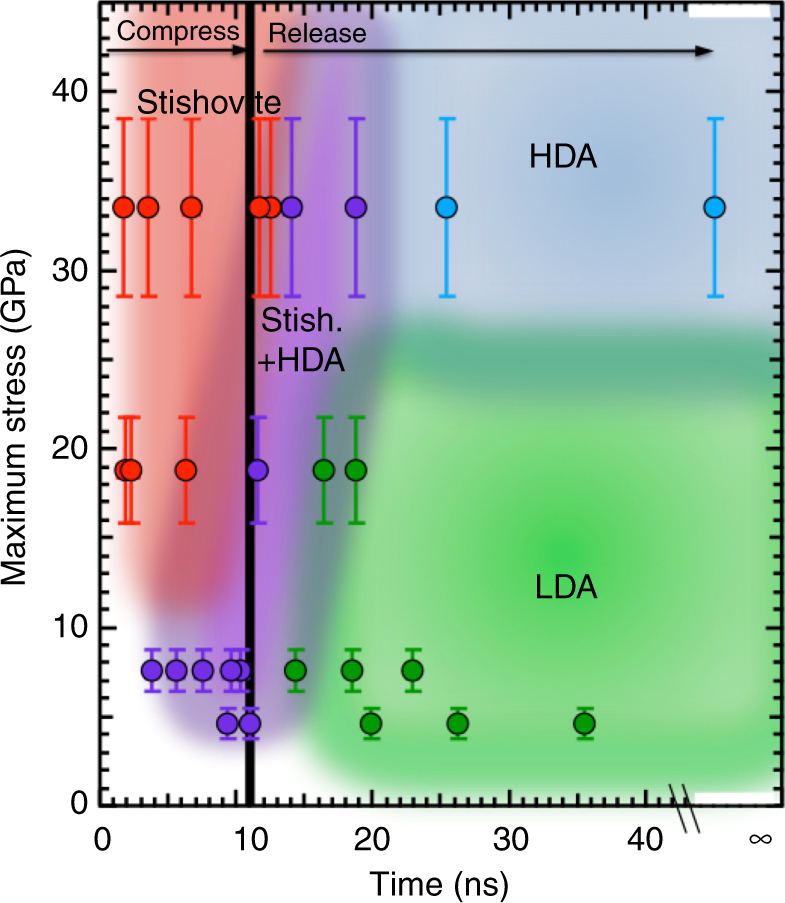
Understanding how rock-forming minerals transform under shock loading is critical for modeling collisions between planetary bodies, interpreting the significance of shock features in minerals and for using them as diagnostic indicators of impact conditions, such as shock pressure. To date, our understanding of the formation processes experienced by shocked materials is based exclusively on ex situ analyses of recovered samples. Formation mechanisms and origins of commonly observed mesoscale material features, such as diaplectic (i.e., shocked) glass, remain therefore controversial and unresolvable. Here we show in situ pump-probe X-ray diffraction measurements on fused silica crystallizing to stishovite on shock compression and then converting to an amorphous phase on shock release in only 2.4 ns from 33.6 GPa. Recovered glass fragments suggest permanent densification. These observations of real-time diaplectic glass formation attest that it is a back-transformation product of stishovite with implications for revising traditional shock metamorphism stages.


Conflict of interest statement

The authors declare no competing financial interests.

Figures

Fig. 1
Fig. 1
Experimental configuration and explored phase space. a Target schematic for sample during the shock-release process. During the onset of release, newly formed grains of stishovite (green sphere-like features) dissolve over a few nanoseconds leaving behind diaplectic glass. b Equilibrium phase diagram of SiO2 showing high-pressure polymorphic phase boundaries and melt curve (black). The fused silica Hugoniot (gray) using data,,. Red points are maximum pressure, temperature conditions achieved for particular ablation drive laser parameters as determined from velocimetry records. The error bars include scatter in the measured transit times, uncertainty in the total sample thickness, uncertainty in the pressure-irradiance scaling law. Isentropic release paths (blue arrows, determined using Sekine et al.) show the approximate conditions achieved in this experiment at late time delays, e.g., 12–30 ns (i.e., during release), and release shock temperatures are determined from post shock temperatures for fused silica
Fig. 2
Fig. 2
Multiplot of XRD data. Stishovite peaks are labeled at the top; ambient condition positions (gray dashed lines). Traces are clustered according to maximum applied pressure with time delays listed on shock-release. Offset along the y axis and color scheme of the traces are arbitrary to enable viewing clarity. Discontinuities in the traces are seen at 32.5°, 46.0° and 58.0° 2θ due to spacing between the mosaicked active areas of the detectors
Fig. 3
Fig. 3
Time-dependence and S(Q) for first sharp diffraction peak. a For each trace, corresponding to a time delay within a given pressure data set, the peak center of the first sharp diffraction peak d-spacing is measured from the raw data, where the error bar indicates one standard deviation for the Gaussian profile fit. The trend for the lowest three pressures appears to return to a d-spacing similar to the original fused silica starting material. However, the highest pressure, time-infinity trace (Supplementary Fig. 2) from the recovered material shows a smaller d-spacing consistent with a trend consistent with a (possibly) higher density diaplectic glass. b The X-ray structure factor, S(Q) for the starting material fused silica (black curve) and recovered material (red curve), both collected at 25 keV, is used to determine the real space correlations in the glass
Fig. 4
Fig. 4
Reaction diagram of SiO2 under shock compression. Metastabilty phase diagram showing peak pressure phase as a function of time from compression and release path. Colored area approximately cluster similar phases to show pressure (and associated shock temperature)—time boundaries. Stress error bars are determined from velocimetry and include scatter in the measured transit times, uncertainty in the total sample thickness, uncertainty in the pressure-irradiance scaling law

References

    1. Langenhorst, F. & Deutsch, A. in Advanced Mineralogy, Vol. 3 (Springer, Berlin, Germany, 1998).
    1. Sharp, T. & DeCarli, P. in Meteorites and the Early Solar System II (University of Arizona, 2006).
    1. Gratz A, et al. Shock metamorphism of quartz with initial temperatures −70 to + 1000°C. Phys. Chem. Miner. 1992;19:267–288. doi: 10.1007/BF00204005. - DOI
    1. Luo S, Ahrens T, Asimow P. Polymorphism, superheating and amorphization of silica upon shock wave loading and release. J. Geophys. Res. 2003;108:2421.
    1. Machon D, Meersman F, Wilding M, Wilson M, McMillan P. Pressure-induced amorphization and polyamorphism: inorganic and biochemical systems. Prog. Mater. Sci. 2014;61:216–282. doi: 10.1016/j.pmatsci.2013.12.002. - DOI

Publication types

LinkOut - more resources