. 2017 Nov 13;7(1):15424.
doi: 10.1038/s41598-017-14970-0.

Nitric oxide mediated inhibition of antigen presentation from DCs to CD4+ T cells in cancer and measurement of STAT1 nitration

Affiliations

Nitric oxide mediated inhibition of antigen presentation from DCs to CD4+ T cells in cancer and measurement of STAT1 nitration

Joseph Markowitz et al. Sci Rep. .

Erratum in

Abstract

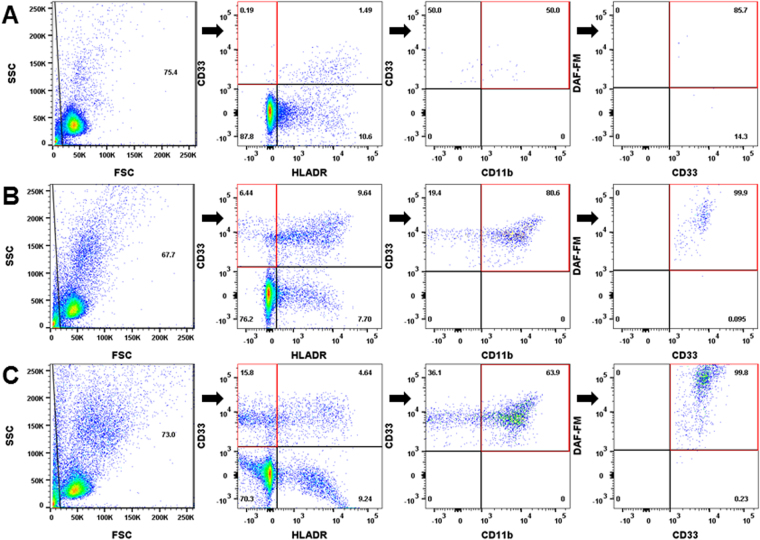
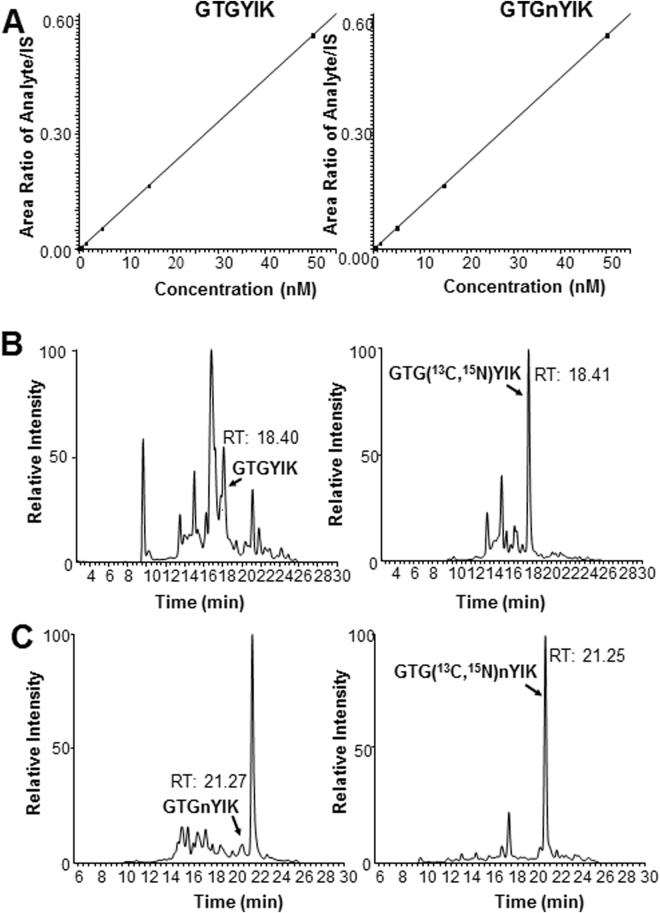
Myeloid derived suppressor cells (MDSC) produce nitric oxide (NO) and inhibit dendritic cell (DC) immune responses in cancer. DCs present cancer cell antigens to CD4+ T cells through Jak-STAT signal transduction. In this study, NO donors (SNAP and DETA-NONOate) inhibited DC antigen presentation. As expected, MDSC isolated from peripheral blood mononuclear cells (PBMC) from cancer patients produced high NO levels. We hypothesized that NO producing MDSC in tumor-bearing hosts would inhibit DC antigen presentation. Antigen presentation from DCs to CD4+ T cells (T cell receptor transgenic OT-II) was measured via a [3H]-thymidine incorporation proliferation assay. MDSC from melanoma tumor models decreased the levels of proliferation more than pancreatic cancer derived MDSC. T cell proliferation was restored when MDSC were treated with inhibitors of inducible nitric oxide synthase (L-NAME and NCX-4016). A NO donor inhibited OT II T cell receptor recognition of OT II specific tetramers, thus serving as a direct measure of NO inhibition of antigen presentation. Our group has previously demonstrated that STAT1 nitration also mediates MDSC inhibitory effects on immune cells. Therefore, a novel liquid chromatography-tandem mass spectrometry assay demonstrated that nitration of the STAT1-Tyr701 occurs in PBMC derived from both pancreatic cancer and melanoma patients.


Conflict of interest statement

The authors declare that they have no competing interests.

Figures

Figure 1
Figure 1
NO decreases antigen presentation from DCs to CD4+ T cells. The effects of NO on DC function were evaluated using transgenic mice that express a T cell receptor (TCR) specific for a defined antigen, namely ovalbumin (OVA). DCs and CD4+ T cells purified from the spleen and lymph nodes of an OT-II mouse were treated with anti-CD3 (global T cell activating treatment), the OVA 329–337 peptide, or whole OVA protein in the presence or absence of NO donors DETA-NONOate (panel A) or SNAP (panel B). Lipopolysaccharide (LPS) is a control for nonspecific inflammation. The data was log transformed and analyzed with one way ANOVA with the Bonferroni correction.
Figure 2
Figure 2
Normal PBMC have few cells with the MDSC phenotype and reduced levels of NO. (A) Normal PBMC derived from the peripheral blood of a normal donor were gated for HLADRnegCD11b+CD33+ cells. Right panel – the same cells stained for NO using DAF-FM. (B) PBMC derived from the peripheral blood of a melanoma patient were gated for HLADRnegCD11b+CD33+ cells. Right panel - The same cells stained for NO using DAF-FM demonstrating that NO is produced by human MDSCs derived from melanoma patients. (C) NO is also produced by HLA-DRCD11b+CD33+ MDSCs derived from the blood of pancreatic cancer patients.
Figure 3
Figure 3
MDSC decrease antigen presentation from DCs to CD4+ T cells. (A) DCs and CD4+ T cells purified from the spleen and lymph nodes of an OT-II mouse were treated in the presence or absence of MDSC (granulocytic + monocytic) obtained from a pancreatic cancer model and normal myeloid cells. Myeloid cells obtained from untreated C56BL/6 mice did not suppress proliferation in the antigen presentation assay. (B) DCs and CD4+ T cells were treated in the presence of granulocytic or monocytic MDSC obtained from the murine melanoma model and demonstrated increased inhibition of antigen presentation (p < 0.001, ANOVA with Bonferroni correction). (CF) The ability of T cells derived from the OTII mouse to detect OVA specific tetratmers was measured in the presence and absence of the nitric oxide donor, DETA-NONOate. Specifically T cells were stimulated with 10 µg/mL OTII peptide cultured for 48 hours. After 48 hours OTII specific tetramers were measured on CD3+CD4+ T cells. (C) Unstimulated, (D). Stimulated for 48 hours without DETA-NONOate, (E). Stimulated for 48 hours with 50 µM DETA-NONOate, and (F) Stimuated for 48 hours with 100 µM DETA-NONOate. Each experiment was performed in duplicate utilizing cells from different OTII mice and demonstrated similar results. A representative plot is presented for each condition. Addition of 50 µM DETA-NONOate demonstrated 68.3 ± 1.5% decrease in the ability of the TCR to recognize OTII specific antigen. Addition of 100 µM DETA-NONOate demonstrated 76.5 ± 1.9% decrease in the ability of the TCR to recognize OTII specific antigen. The viability of the cells was not significantly altered as demonstrated in (Supplemental Fig. 3).
Figure 4
Figure 4
MDSC inhibition of antigen presentation from DCs to T cells is abrogated in the presence of a nitroaspirin. DCs and CD4+ T cells purified from the spleen and lymph nodes of an OT-II mouse were treated in the presence or absence of granulocytic or monocytic MDSC derived from the B16-F10 or Panc02 murine models. (A,B) Addition of granulocytic MDSC (A) or monocytic MDSC (B) obtained from the melanoma model (B16-F10) to the co-culture of T cells and DCs reduced proliferation by (0.70 fold of control (p < 0.001, 95% CI (0.64, 0.76), one-way ANOVA with Bonferroni correction), (0.80 fold of control (p < 0.001, 95% CI (0.74, 0.86), one-way ANOVA with Bonferroni correction), respectively. When granulocytic or monocytic MDSC were pre-treated with L-NAME and then added to the DC-T cell co-culture, proliferation in the setting of antigen presentation of DC to CD4+ T cells was restored (p < 0.001, p < 0.001), respectively. (C) T,DC, and MDSC single cell controls for antigen presentation demonstrate limited proliferation. (D) Addition of granulocytic MDSC obtained from a pancreatic cancer Panc02 murine model to the co-culture of T cells and DCs trended to reduced proliferation by 0.88 fold of control (p = 0.065; 95% CI (0.79, 0.97); one-way ANOVA with Bonferroni correction). When MDSC were pre-treated with a nitroaspirin and then added to DC-T cell co-culture, proliferation in the setting of antigen presentation of DC to CD4+ T cells was restored (p = 0.013; one-way ANOVA with Bonferroni correction). Addition of monocytic MDSC demonstrated a variable effect on proliferation of the DC-T co-culture. (E,F) Addition of granulocytic MDSC (E) or monocytic MDSC obtained from the melanoma model (B16-F10), to the co-culture of T cells and DCs reduced proliferation as seen in (A,B). When granulocytic or monocytic MDSC were pre-treated with NCX-4016 and then added to the DC-T cell co-culture, proliferation in the setting of antigen presentation of DC to CD4+ T cells was restored for both the granulocytic subset (p < 0.001), and the monocytic subset (p = 0.015), respectively.
Figure 5
Figure 5
Mass spectrum of a peptide from STAT1 containing Tyr701. Top panel – Full length STAT1 protein was treated with peroxynitrite and subjected to trypsin cleavage. The resulting peptides were run on the HPLC and Orbitrap mass spectrometer. The HPLC and mass spectra of the native peptide are presented. Bottom panel - Spectrum of NO-treated STAT1 (GTGnYIK). There is a shift in the retention time and m/z ratio observed for nitrated Tyr701. The fragmentation pattern important for identifying the nitration moiety is demonstrated in the figure. Labeling for N-terminal or “b” fragments and C-terminal or “y” fragments is consistent with standardized nomenclature in proteomics research. Please refer to for more details on this nomenclature.
Figure 6
Figure 6
Mass Spectrometry SRM experiments detects both the native STAT1 (GTGYIK) and nitrated STAT1 (GTGnYIK) at position 701. (A) Calibration curves of GTGYIK from 0.05–50 nM R2 = 0.9996 (STAT1), R2 = 0.9961 (nSTAT1). (B) SRM chromatograms of GTGYIK, and its isotopic peptides containing 13C and 15N in the amino acid glycine at position 3 of the peptide in PBMC control samples. (C) SRM chromatograms of GTGnYIK and isotopic peptide spike-in GTG(13C, 15N)nYIK in PBMC control samples.
Figure 7
Figure 7
STAT1 is nitrated in melanoma and pancreatic cancer patients. (A) SRM chromatograms of GTGYIK and their isotopic peptide spike-in GTG(13C, 15N)YIK in PBMC obtained from patients. (B) SRM chromatograms of GTGnYIK (nitrated) and their isotopic peptide spike-in GTG(13C, 15N)nYIK in PBMC obtained from patients. (C) Measurement of the ratio of the concentration of GTGnYIK to the concentration of GTGYIK for 9 normal donors (0.14 ± 0.036) and 16 cancer patients (8 melanoma patients and 8 pancreatic cancer patients, 0.30 ± 0.24), p = 0.036, T test).

References

    1. Gabrilovich DI, Ostrand-Rosenberg S, Bronte V. Coordinated regulation of myeloid cells by tumours. Nat Rev Immunol. 2012;12:253–268. doi: 10.1038/nri3175. - DOI - PMC - PubMed
    1. Gabrilovich D. Mechanisms and functional significance of tumour-induced dendritic-cell defects. Nat Rev Immunol. 2004;4:941–952. doi: 10.1038/nri1498. - DOI - PubMed
    1. Diamond MS, et al. Type I interferon is selectively required by dendritic cells for immune rejection of tumors. The Journal of experimental medicine. 2011;208:1989–2003. doi: 10.1084/jem.20101158. - DOI - PMC - PubMed
    1. Gajewski TF, Fuertes MB, Woo SR. Innate immune sensing of cancer: clues from an identified role for type I IFNs. Cancer immunology, immunotherapy: CII. 2012;61:1343–1347. doi: 10.1007/s00262-012-1305-6. - DOI - PMC - PubMed
    1. Montoya M, et al. Type I interferons produced by dendritic cells promote their phenotypic and functional activation. Blood. 2002;99:3263–3271. doi: 10.1182/blood.V99.9.3263. - DOI - PubMed

Publication types

MeSH terms