. 2017 Nov 13;8(1):1469.
doi: 10.1038/s41467-017-01747-2.

Region and cell-type resolved quantitative proteomic map of the human heart

Affiliations

Region and cell-type resolved quantitative proteomic map of the human heart

Sophia Doll et al. Nat Commun. .

Abstract

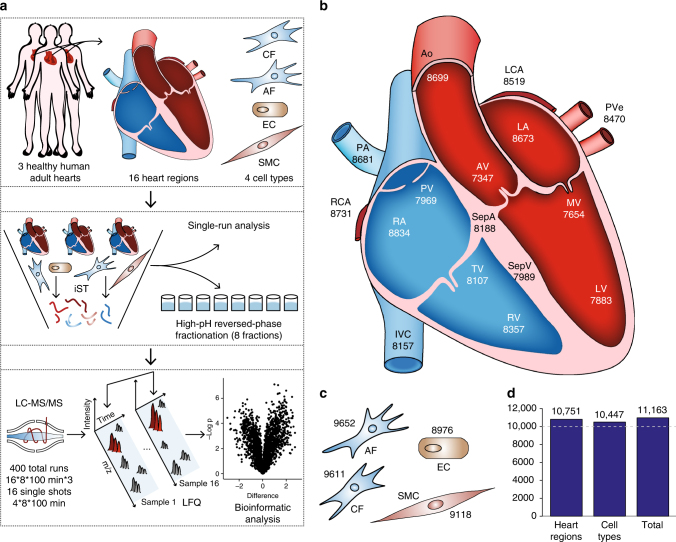
The heart is a central human organ and its diseases are the leading cause of death worldwide, but an in-depth knowledge of the identity and quantity of its constituent proteins is still lacking. Here, we determine the healthy human heart proteome by measuring 16 anatomical regions and three major cardiac cell types by high-resolution mass spectrometry-based proteomics. From low microgram sample amounts, we quantify over 10,700 proteins in this high dynamic range tissue. We combine copy numbers per cell with protein organellar assignments to build a model of the heart proteome at the subcellular level. Analysis of cardiac fibroblasts identifies cellular receptors as potential cell surface markers. Application of our heart map to atrial fibrillation reveals individually distinct mitochondrial dysfunctions. The heart map is available at maxqb.biochem.mpg.de as a resource for future analyses of normal heart function and disease.


Conflict of interest statement

The authors declare no competing financial interests.

Figures

Fig. 1
Fig. 1
The quantitative landscape of the human heart proteome. a Experimental design, including the source of material (upper panel), in-depth vs. single-run analyses (middle panel), and schematic depiction of the analytical workflow (lower panel). b Graphical illustration of the human heart showing the total number of quantified proteins in each region. c Quantified proteins in three cardiac cell types and adipose fibroblasts. d Bar plot of the total number of quantified proteins in all heart regions, cell types, and the entire data set
Fig. 2
Fig. 2
Principal component analysis (PCA) of the 16 heart regions based on their proteomic expression profiles. a The proteomes of the cavities (RA, LA, RV, LV, SepA, and SepV), vessels (Ao, PA, RCA, LCA, IVC, and PVe), and valves (TV, MV, AV, and PV) depicted by replicate number (individuals 1, 2, and 3). The first and second component segregate the heart areas and account for 32.3 and 9% of the variability, respectively. b Proteins driving the segregation between the three heart areas. c Cavities segregate into the ventricular and atrial part, d vessels into coronary arteries (RCA, LCA) and outgoing vessels (Ao, PA), and e valves into ventricular (MV, TV) and semilunar valves (AV, PV)
Fig. 3
Fig. 3
Proteins differentially expressed across the different heart areas. a Heat map of z-scored protein abundances (LFQ intensities) of the differentially expressed proteins (ANOVA, FDR < 0.05) after unsupervised hierarchical clustering reveals proteins significantly upregulated in the cavities, vessels, or valves (highlighted in yellow: A, B, and C). b The upper panel shows a schematic of an average heart cavity cell, where organelles are sized according to their contribution to total protein mass. Percentages are taken from the median of all cavities and scaled to account for unassigned proteins. The lower panel shows the contribution of each organelle to cellular protein mass, as a percentage of the total, in each heart region
Fig. 4
Fig. 4
Proteins differentially expressed in human heart regions. Volcano plots of the p values vs. the log2 protein abundance differences between regions, with proteins outside the significance lines colored in red or blue (FDR < 0.05). p values are calculated from the data of three healthy hearts. a Ventricular (LV, RV, and SepV) compared to the atrial (LA, RA, and SepA) regions, b coronary arteries (LCA, RCA) compared to arteries (Ao, PA), and c semilunar (AV, PV) compared to atrioventricular (TV, MV) valves
Fig. 5
Fig. 5
Comparative analysis of the cell-type proteomes. a Commonly and exclusively quantified proteins in three cardiac cell types and adipose fibroblasts. b PCA comparing the four cell types based on component 1 and 2, which accounted for 50.6 and 30.5% of the variability, respectively. c Cumulative protein abundances for each cell type and total number of proteins constituting the quantiles (Q1–Q4). The corresponding cell types are illustrated with immunofluorescence pictures at ×100 magnification. d RT-qPCR (green) and proteomic (red) fold-changes of the indicated genes in CF compared to all other cell types
Fig. 6
Fig. 6
Clinical application of the healthy human heart atlas to atrial fibrillation. a Experimental workflow: LA tissues from three atrial fibrillation patients (AFib) were single-runs of technical triplicates. Data were matched against the healthy human LA library. b Volcano plot of the p values vs. the log2 protein abundance differences in AFib compared to healthy LA. Significantly up- and downregulated proteins are highlighted in red and blue, respectively (FDR 0.05)

References

    1. Xin M, Olson EN, Bassel-Duby R. Mending broken hearts: cardiac development as a basis for adult heart regeneration and repair. Nat. Rev. Mol. Cell Biol. 2013;14:529–541. doi: 10.1038/nrm3619. - DOI - PMC - PubMed
    1. Bergmann O, et al. Dynamics of cell generation and turnover in the human heart. Cell. 2015;161:1566–1575. doi: 10.1016/j.cell.2015.05.026. - DOI - PubMed
    1. Pinto AR, et al. Revisiting cardiac cellular composition novelty and significance. Circ. Res. 2016;118:400–409. doi: 10.1161/CIRCRESAHA.115.307778. - DOI - PMC - PubMed
    1. Celermajer DS, Chow CK, Marijon E, Anstey NM, Woo KS. Cardiovascular disease in the developing world: prevalences, patterns, and the potential of early disease detection. J. Am. Coll. Cardiol. 2012;60:1207–1216. doi: 10.1016/j.jacc.2012.03.074. - DOI - PubMed
    1. Aye TT, et al. Proteome-wide protein concentrations in the human heart. Mol. BioSyst. 2010;6:1917–1927. doi: 10.1039/c004495d. - DOI - PubMed

Publication types