. 2017 Nov 14;8(1):1483.
doi: 10.1038/s41467-017-01525-0.

Network inference from glycoproteomics data reveals new reactions in the IgG glycosylation pathway

Affiliations

Network inference from glycoproteomics data reveals new reactions in the IgG glycosylation pathway

Elisa Benedetti et al. Nat Commun. .

Erratum in

  • Publisher Correction: Network inference from glycoproteomics data reveals new reactions in the IgG glycosylation pathway.
    Benedetti E, Pučić-Baković M, Keser T, Wahl A, Hassinen A, Yang JY, Liu L, Trbojević-Akmačić I, Razdorov G, Štambuk J, Klarić L, Ugrina I, Selman MHJ, Wuhrer M, Rudan I, Polasek O, Hayward C, Grallert H, Strauch K, Peters A, Meitinger T, Gieger C, Vilaj M, Boons GJ, Moremen KW, Ovchinnikova T, Bovin N, Kellokumpu S, Theis FJ, Lauc G, Krumsiek J. Benedetti E, et al. Nat Commun. 2018 Feb 13;9(1):706. doi: 10.1038/s41467-017-02379-2. Nat Commun. 2018. PMID: 29440641 Free PMC article.

Abstract

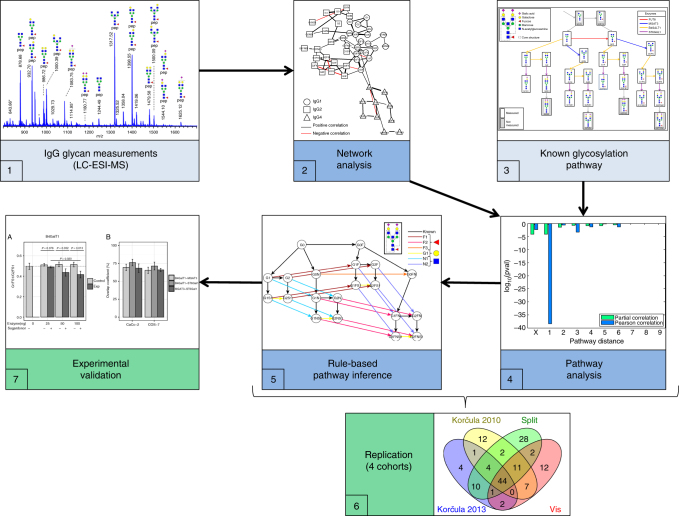
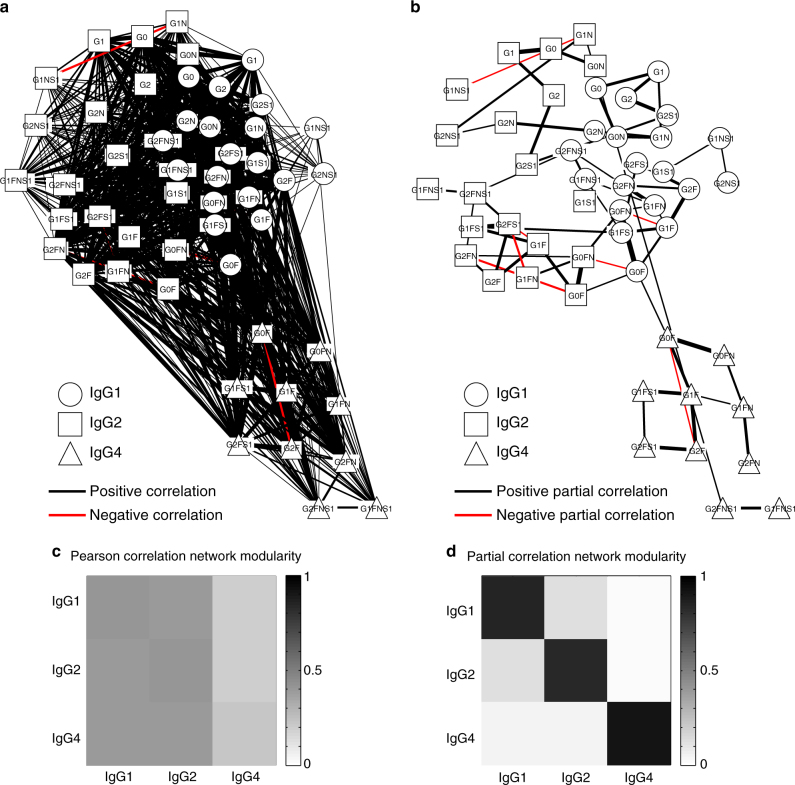
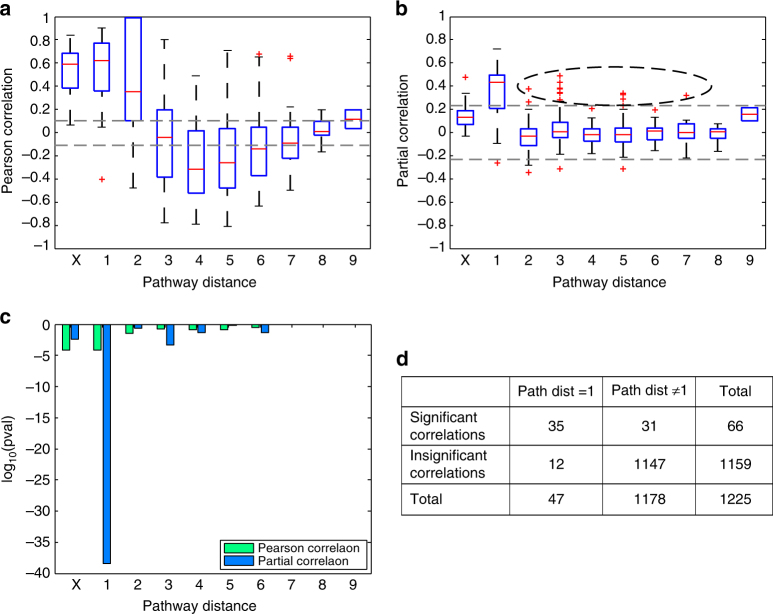
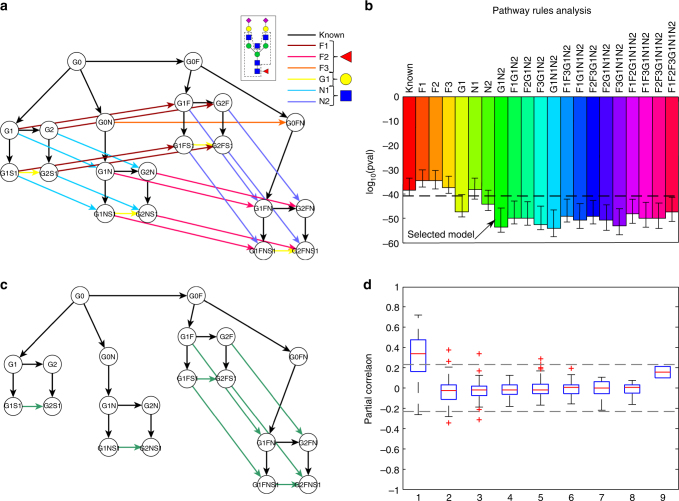
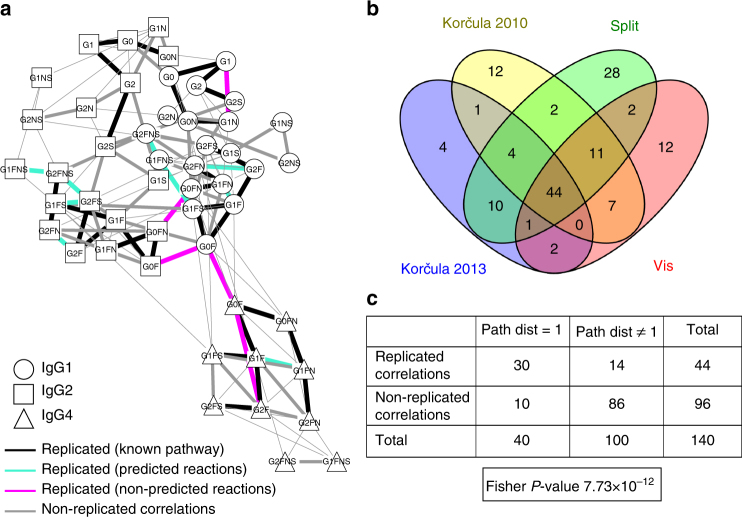
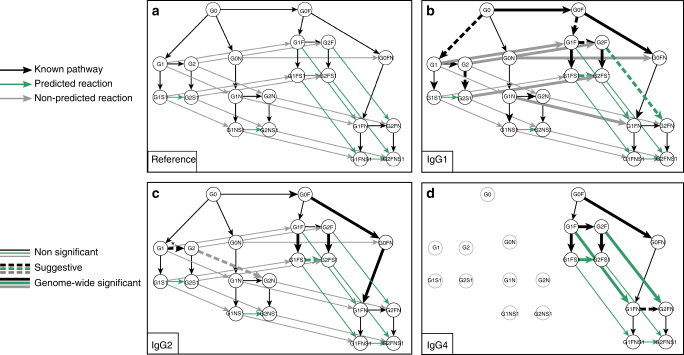
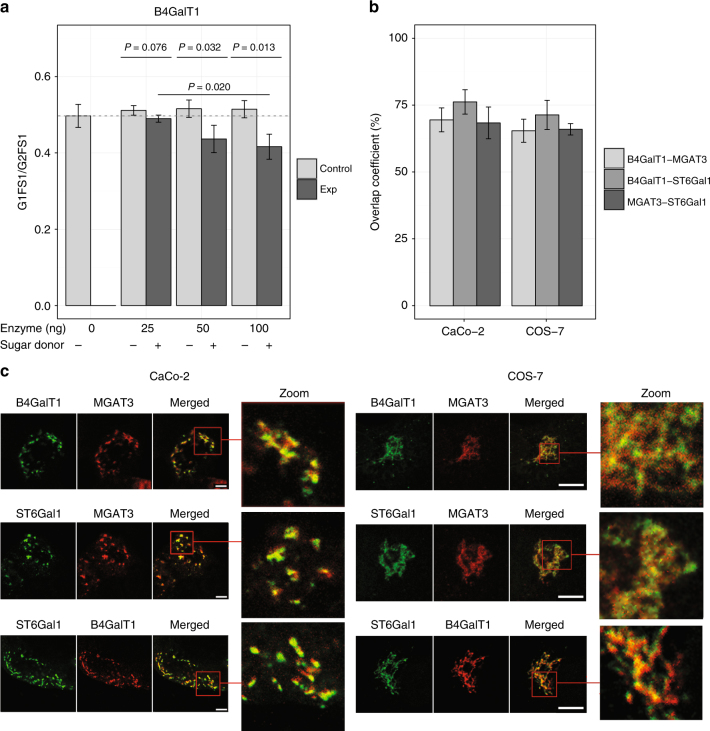
Immunoglobulin G (IgG) is a major effector molecule of the human immune response, and aberrations in IgG glycosylation are linked to various diseases. However, the molecular mechanisms underlying protein glycosylation are still poorly understood. We present a data-driven approach to infer reactions in the IgG glycosylation pathway using large-scale mass-spectrometry measurements. Gaussian graphical models are used to construct association networks from four cohorts. We find that glycan pairs with high partial correlations represent enzymatic reactions in the known glycosylation pathway, and then predict new biochemical reactions using a rule-based approach. Validation is performed using data from a GWAS and results from three in vitro experiments. We show that one predicted reaction is enzymatically feasible and that one rejected reaction does not occur in vitro. Moreover, in contrast to previous knowledge, enzymes involved in our predictions colocalize in the Golgi of two cell lines, further confirming the in silico predictions.


Conflict of interest statement

G.L. declares that he is a founder and owner of Genos, a private research organization that specializes in high-throughput glycomics and has several patents in the field. M.P.-B., I.T.-A., G.R., J.S., L.K. and M.V. are employees of Genos. The remaining authors declare no competing financial interests.

Figures

Fig. 1
Fig. 1
Analytical procedure. Starting from the IgG glycan abundances measured using LC-ESI-MS (1), we calculated a correlation-based network (2) and mapped it to the known IgG glycosylation pathway (3). We found that most edges in the network corresponded to single enzymatic steps in the pathway (4). Based on this finding, we inferred unknown enzymatic reactions that were putatively involved in the synthesis of IgG glycans using a rule-based approach (5). We then replicated the findings using four cohorts (6) and performed different in vitro validation experiments to confirm the predicted reactions (7)
Fig. 2
Fig. 2
IgG glycan structures and the known glycosylation pathway. IgG glycans are biantennary complex-type structures: all measured glycoforms have a common core structure (the G0 structure, top left) to which additional sugars can be attached. The glycan names describe how many galactoses (G0/G1/G2) are present, whether there is a core fucose (F) or a bisecting N-acetylglucosamine (also referred to as GlcNAc, N), and whether the structure includes one or two sialic acids (S1/S2). The known glycosylation pathway as described in the review of Taniguchi is shown, with boxes representing glycan structures and arrows representing single enzymatic reactions in the synthesis process. Each enzymatic reaction involves the addition of a single sugar unit to the glycan structure. The 20 glycoforms measured in this study are produced by four enzymes (FUT8, B4GalT1, MGAT3, and ST6Gal1). The gray boxes represent IgG glycoforms that were not measured in the present study. For a list of the primary literature describing the in vitro experiments which the pathway is based on, see Supplementary Fig. 1
Fig. 3
Fig. 3
Network representation and modularity. a, b Pearson and partial correlation matrices, respectively, visualized as networks, where the nodes represent different glycoforms, and the edges indicate significant positive (black) and negative (red) correlations. Different node shapes correspond to different IgG subclasses, while the thickness of each edge corresponds to the magnitude of the respective correlation. c, d Pearson and partial correlation modularity, respectively, between IgG subclasses, measured as the relative out-degree from each subclass (row) to each other subclass (column). A Pearson correlation modularity analysis showed that all subclasses were highly interconnected. By contrast, the GGM showed high subclass modularity, indicating that associations between glycans mostly occurred within each IgG subclass. Furthermore, while the first two IgG subclasses were slightly interconnected, the Ig4 subclass was mostly isolated in the network
Fig. 4
Fig. 4
Systematic comparison of correlations and pathway distances. a, b Pearson and partial correlation coefficients, respectively, vs. pathway distance. Gray dashed lines represent the significance threshold (FDR = 0.01). On each box, the central mark indicates the median, and the whiskers indicate the 25th and 75th percentiles, respectively. The label “X” represents correlations between the same glycoforms across different IgG subclasses. In line with the network visualization, we observed significant Pearson correlation coefficients across all pathway distances, suggesting that Pearson correlations are non-specific with respect to the IgG glycosylation pathway. By contrast, significant partial correlation coefficients accumulated at a pathway distance of 1. The black dashed oval highlights significant partial correlations for pathway distances >1. c P-values for Fisher’s exact tests for both Pearson and partial correlations at different pathway distances. There were significantly more significant partial correlations between glycans with a pathway distance of 1, demonstrating a close relationship between the IgG glycosylation pathway and the reconstructed GGM. The log10 P-values can be interpreted as a variance-normalized measure of the effect size. d Contingency table for the partial correlations at a pathway distance of 1. Entries represent the numbers of partial correlations satisfying the corresponding conditions
Fig. 5
Fig. 5
Rule-based approach for pathway inference. a Sketch of all single-monosaccharide additions in the IgG glycosylation pathway. The black network represents the known IgG glycosylation pathway, while arrows with the same color describe a rule. Shades of the same color represent reactions performed by the same enzyme. b Fisher’s exact test results for the addition of different combinations of rules to the known pathway. The pathway model that most resembles the biological truth is expected to have the best overlap with the calculated GGM and hence yield a lower P-value. The black dashed line represents the lower end of the 95% confidence interval of the P-value for the known pathway obtained by bootstrapping. The simplest model that was significantly more accurate than the known pathway is indicated by a black arrow and includes rules G1 and N2. For a full list of results, see Supplementary Data 2. c Pathway model inferred by our approach. d Partial correlation coefficients for different pathway distances in the selected model. On each box, the central mark indicates the median, and the whiskers indicate the 25th and 75th percentiles, respectively. Most of the significant partial correlations that were a long distance apart in the known pathway are now at a distance of 1 (cf. Fig. 4b)
Fig. 6
Fig. 6
Replication. a Consensus network. Black edges represent replicated partial correlations that correspond to direct enzymatic steps in the known IgG glycosylation pathway, green edges represent replicated edges matching the reactions predicted by our approach, and red edges represent replicated correlations corresponding to reactions that were not predicted to take part in IgG glycosylation. Replicated edges were defined as partial correlations that were significant in all four cohorts. Gray edges represent partial correlations that were significant in at least one cohort but not in all four. Note that three of the five replicated but non-predicted edges linked the same glycan structure in different IgG subclasses, which we did not consider in our inference approach. Thus, there are only two edges that are truly non-predicted. b Venn diagram of the significant partial correlations in the four cohorts. In total, 44 edges were shared among all four cohorts. c Contingency table for the partial correlation coefficients that were found to be significant in at least one of the four considered cohorts. The classification variables in this case are replication status and pathway distance. Here, we considered edges that were significant in at least one of the four cohorts, and we considered an edge to be replicated if it occurred in all four cohorts. The resulting P-value was very low, indicating that replicated edges are more likely to represent enzymatic reactions than non-replicated edges
Fig. 7
Fig. 7
GWAS results for glycan ratios. a Reference pathway for interpreting the GWAS results. Black lines represent reactions in the known IgG glycosylation pathway, green lines represent reactions associated with the predicted rules, and gray lines represent possible reactions that were not selected by our approach. bd GWAS results for IgG1, IgG2, and IgG4, respectively. Solid thick arrows represent ratios that were significantly associated with SNPs in the regions coding for an IgG glycosylation enzyme (P < 5.26 × 10−10 and p-gain > 10). Dashed arrows represent suggestive associations (5.26 × 10−10 ≤ P ≤ 10−7 and p-gain > 10). Gray nodes in the IgG4 plot represent glycoforms that were not measured. The asterisk indicates that the ratio was unexpectedly associated with SNPs in the FUT8 gene region
Fig. 8
Fig. 8
Experimental validation results. a In vitro enzymatic assay. The figure illustrates the ratio of G1FS1 over G2FS1 across different concentrations of the enzyme (B4GalT1), and in presence or absence of sugar donors. Bars represent the average value over triplicates, while error bars represent standard deviations. With increasing enzyme concentrations, the glycan ratio decreases significantly with respect to the corresponding negative control, confirming the occurrence of the predicted reaction. P-values were obtained from a two sample t-test. b Quantitative overlap between the localization of the three enzymes. The overall colocalization of each enzyme pair is expressed as an overlap coefficient percentage (mean % ± standard deviation). We observe substantial colocalization of all enzyme pairs in both cell lines. c Exemplary colocalization images of B4GalT1, ST6Gal-1, and MGAT3 in CaCo-2 (left) and COS-7 (right) cells, used for the overlap quantification in b. The individual figures represent a typical view from five different Golgi areas examined. In the images labeled as “Merged” and “Zoom”, yellow areas represent enzymatic overlap. Due to the dispersed Golgi stacks throughout the cytoplasm in Caco-2 cells, the overlap can be observed clearly in separated cisternae, proving that localization of the glycosyltransferases is not limited to cis-Golgi, medial-Golgi, or trans-Golgi areas. Bar represents 5 μm

References

    1. Lauc G, et al. Glycans—the third revolution in evolution. Biochim. Biophys. Acta. 2014;5:4736–4739.
    1. Gerald BP, Jeffrey BL, Lee MW. Immunology, Infection, and Immunity. Washington DC: ASM Press; 2004.
    1. Nimmerjahn F, Ravetch JV. Fcγ receptors as regulators of immune responses. Nat. Rev. Immunol. 2008;8:34–47. doi: 10.1038/nri2206. - DOI - PubMed
    1. Arnold JN, Wormald MR, Sim RB, Rudd PM, Dwek RA. The impact of glycosylation on the biological function and structure of human immunoglobulins. Annu. Rev. Immunol. 2007;25:21–50. doi: 10.1146/annurev.immunol.25.022106.141702. - DOI - PubMed
    1. Subedi GP, Barb AW. The structural role of antibody N-glycosylation in receptor interactions. Structure. 2015;23:1573–1583. doi: 10.1016/j.str.2015.06.015. - DOI - PMC - PubMed

Publication types

MeSH terms