

Speciation over the edge: gene flow among non-human primate species across a formidable biogeographic barrier
- PMID: 29134059
- PMCID: PMC5666242
- DOI: 10.1098/rsos.170351
Speciation over the edge: gene flow among non-human primate species across a formidable biogeographic barrier
Erratum in
-
Correction to 'Speciation over the edge: gene flow among non-human primate species across a formidable biogeographic barrier'.R Soc Open Sci. 2018 Jun 13;5(6):180736. doi: 10.1098/rsos.180736. eCollection 2018 Jun. R Soc Open Sci. 2018. PMID: 30110472 Free PMC article.
Abstract
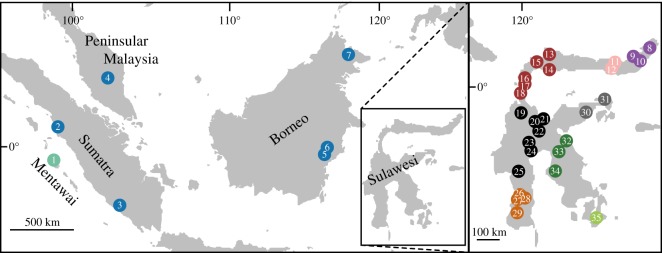
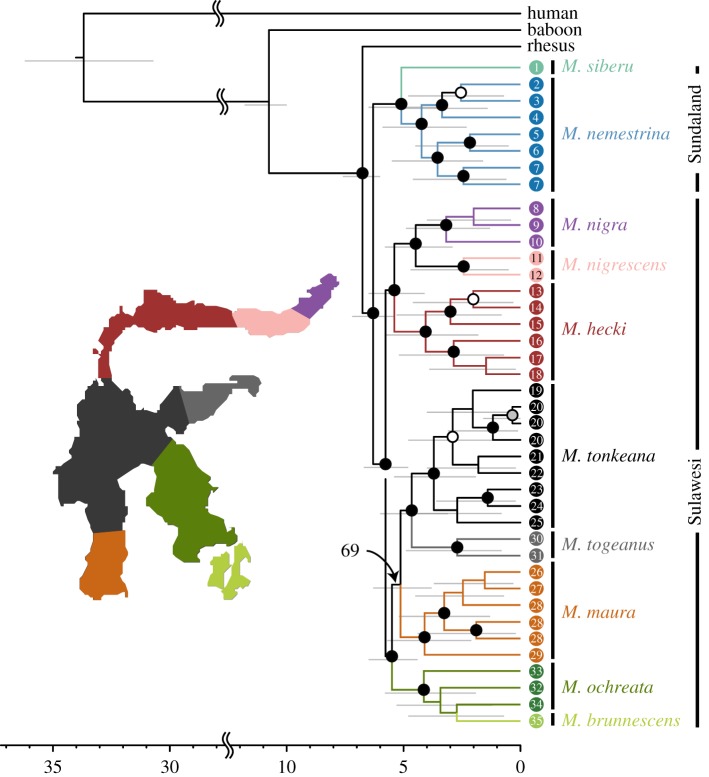
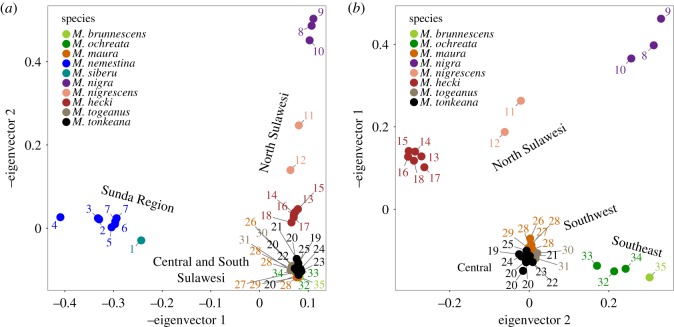
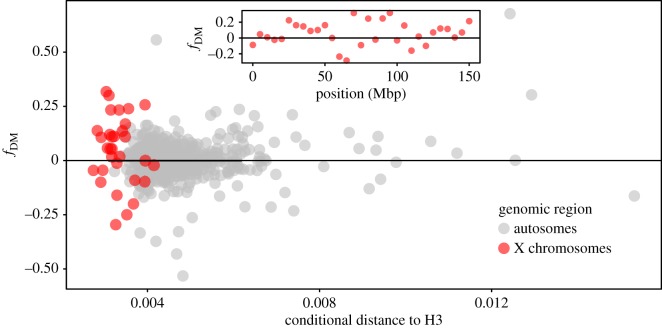
Many genera of terrestrial vertebrates diversified exclusively on one or the other side of Wallace's Line, which lies between Borneo and Sulawesi islands in Southeast Asia, and demarcates one of the sharpest biogeographic transition zones in the world. Macaque monkeys are unusual among vertebrate genera in that they are distributed on both sides of Wallace's Line, raising the question of whether dispersal across this barrier was an evolutionary one-off or a more protracted exchange-and if the latter, what were the genomic consequences. To explore the nature of speciation over the edge of this biogeographic divide, we used genomic data to test for evidence of gene flow between macaque species across Wallace's Line after macaques colonized Sulawesi. We recovered evidence of post-colonization gene flow, most prominently on the X chromosome. These results are consistent with the proposal that gene flow is a pervasive component of speciation-even when barriers to gene flow seem almost insurmountable.
Keywords: Wallace’s Line; X chromosome; gene flow; genomics; mechanisms of speciation; primate evolution.
Conflict of interest statement
We have no competing interests.
Figures
References
-
- de Queiroz K. 2007. Species concepts and species delimitation. Syst. Biol. 56, 879–886. (doi:10.1080/10635150701701083) - DOI - PubMed
-
- Mayr E. 1963. Animal species and evolution. Cambridge, MA: Harvard University Press.
-
- Dobzhansky T, et al. 1970. Genetics of the evolutionary process, vol. 139. New York, NY: Columbia University Press.
-
- Wallace AR. 1863. On the physical geography of the Malay Archipelago. J. R. Geol. Soc. Lond. 33, 217–234. (doi:10.2307/1798448) - DOI
-
- Mayr E. 1944. Wallace’s Line in the light of recent zoogeographic studies. Q. Rev. Biol. 19, 1–14. (doi:10.1086/394684) - DOI
Associated data
LinkOut - more resources
Full Text Sources
Other Literature Sources