

A single center analysis of factors influencing study start-up timeline in clinical trials
- PMID: 29134114
- PMCID: PMC5674216
- DOI: 10.4155/fsoa-2017-0025
A single center analysis of factors influencing study start-up timeline in clinical trials
Abstract
Aim: Efficient start-up phase in clinical trials is crucial to execution. The goal was to determine factors contributing to delays.
Materials & methods: The start-up milestones were assessed for 38 studies and analyzed.
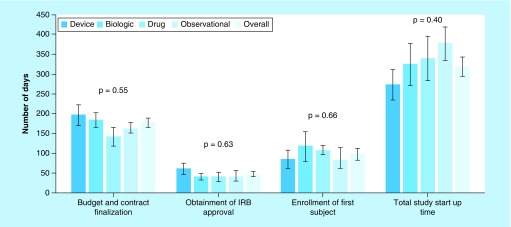
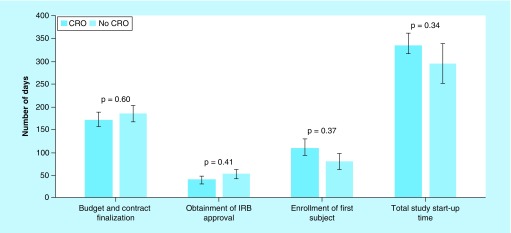
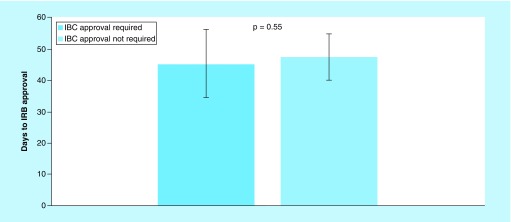
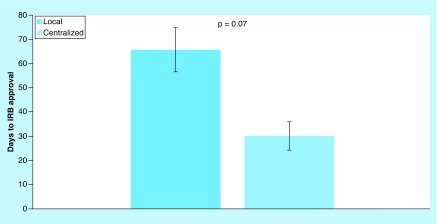
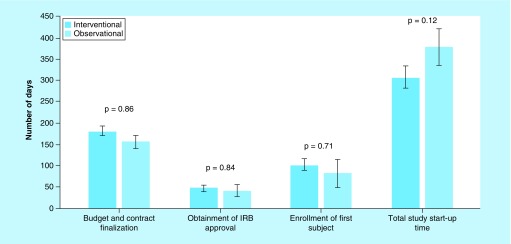
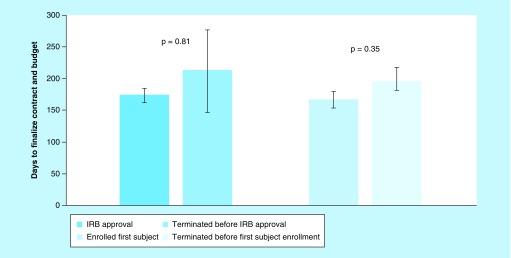
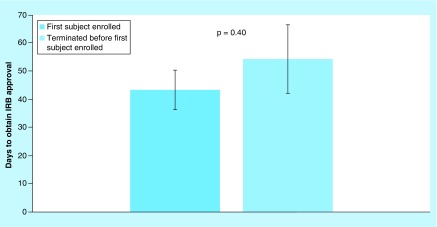
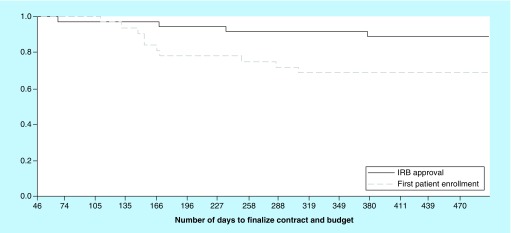
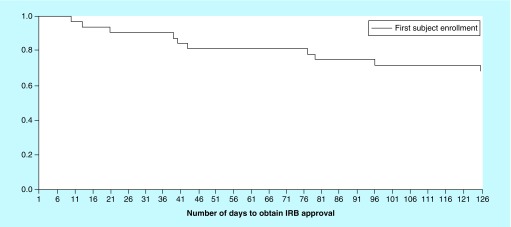
Results: Total start-up time was shorter for following studies: device trials, no outsourcing, fewer ancillary services used and in interventional versus observational designs. The use of a centralized Institutional Review Board (IRB) versus a local IRB reduced time to approval. Studies that never enrolled took longer on average to finalize their budget/contract, and obtain IRB than ones that did enroll.
Conclusion: Different features of clinical trials can affect timeline of start-up process. An understanding of the impact of each feature allows for optimization.
Keywords: clinical trials management; process optimization; start-up metrics; start-up phase; trial efficiency.
Conflict of interest statement
Financial & competing interests disclosure The authors have no relevant affiliations or financial involvement with any organization or entity with a financial interest in or financial conflict with the subject matter or materials discussed in the manuscript. This includes employment, consultancies, honoraria, stock ownership or options, expert testimony, grants or patents received or pending, or royalties. No writing assistance was utilized in the production of this manuscript.
Figures
Similar articles
-
Assessment of North American Clinical Research Site Performance During the Start-up of Large Cardiovascular Clinical Trials.JAMA Netw Open. 2021 Jul 1;4(7):e2117963. doi: 10.1001/jamanetworkopen.2021.17963. JAMA Netw Open. 2021. PMID: 34297072 Free PMC article.
-
A multisite study of performance drivers among institutional review boards.J Clin Transl Sci. 2017 Jun;1(3):192-197. doi: 10.1017/cts.2017.8. Epub 2017 Jul 24. J Clin Transl Sci. 2017. PMID: 29093967 Free PMC article.
-
Transitioning to the National Institutes of Health single institutional review board model: Piloting the use of the Streamlined, Multi-site, Accelerated Resources for Trials IRB Reliance.Clin Trials. 2019 Jun;16(3):290-296. doi: 10.1177/1740774519832911. Epub 2019 Mar 13. Clin Trials. 2019. PMID: 30866676 Free PMC article.
-
Analysis of start-up, retention, and adherence in ALS clinical trials.Neurology. 2013 Oct 8;81(15):1350-5. doi: 10.1212/WNL.0b013e3182a823e0. Epub 2013 Sep 4. Neurology. 2013. PMID: 24005339 Free PMC article. Review.
-
A review finds that multicenter studies face substantial challenges but strategies exist to achieve Institutional Review Board approval.J Clin Epidemiol. 2006 Aug;59(8):784-90. doi: 10.1016/j.jclinepi.2005.11.018. Epub 2006 Mar 15. J Clin Epidemiol. 2006. PMID: 16828670 Review.
Cited by
-
Economic analysis of a single institutional review board data exchange standard in multisite clinical studies.Contemp Clin Trials. 2022 Nov;122:106953. doi: 10.1016/j.cct.2022.106953. Epub 2022 Oct 4. Contemp Clin Trials. 2022. PMID: 36202199 Free PMC article.
-
Drivers of Start-Up Delays in Global Randomized Clinical Trials.Ther Innov Regul Sci. 2021 Jan;55(1):212-227. doi: 10.1007/s43441-020-00207-2. Epub 2020 Sep 21. Ther Innov Regul Sci. 2021. PMID: 32959207 Free PMC article.
-
Streamlining and cycle time reduction of the startup phase of clinical trials.Trials. 2020 Jan 29;21(1):115. doi: 10.1186/s13063-020-4079-8. Trials. 2020. PMID: 31996249 Free PMC article.
-
Exploring the Challenges and Solutions in Conducting Clinical Trials in Saudi Arabia: A Qualitative Study Perspective.Healthcare (Basel). 2024 Nov 1;12(21):2182. doi: 10.3390/healthcare12212182. Healthcare (Basel). 2024. PMID: 39517393 Free PMC article.
-
Assessment of North American Clinical Research Site Performance During the Start-up of Large Cardiovascular Clinical Trials.JAMA Netw Open. 2021 Jul 1;4(7):e2117963. doi: 10.1001/jamanetworkopen.2021.17963. JAMA Netw Open. 2021. PMID: 34297072 Free PMC article.
References
-
- Schimanski C. Streamline and improve study start up. Appl. Clin. Trials. 2013;22(9):22–25.
-
•• Highlights of current improvement strategies for start-up phase are provided.
-
- Howley M, Malamis P. High performing study start ups. Appl. Clin. Trials. 2013 www.appliedclinicaltrialsonline.com/high-performing-study-start-ups
-
•• Updated metrics contributing to higher performance at start-up phase are summarized.
-
- Christel M. New approaches to speeding up clinical trials – what works and what doesn't. Appl. Clin. Trials. 2015 www.appliedclinicaltrialsonline.com/new-approaches-sppeding-clinical-tri...
-
- Lamberti M, Brothers C, Manak D, Getz K. Benchmarking the study initiation process. Ther. Innov. Regul. Sci. 2013;47(1):101–109. - PubMed
-
• Methodology of benchmarking of the study initiation process is described.
-
- Study Start-Up Takes Longer for CROs: Results from KMR group outsourcing performance study. 2013. www.biospace.com/News/study-start-up-takes-longer-for-cros-results-from/...
LinkOut - more resources
Full Text Sources
Other Literature Sources