

Synchronized Spontaneous Otoacoustic Emissions Provide a Signal-to-Noise Ratio Advantage in Medial-Olivocochlear Reflex Assays
- PMID: 29134475
- PMCID: PMC5783927
- DOI: 10.1007/s10162-017-0645-5
Synchronized Spontaneous Otoacoustic Emissions Provide a Signal-to-Noise Ratio Advantage in Medial-Olivocochlear Reflex Assays
Abstract
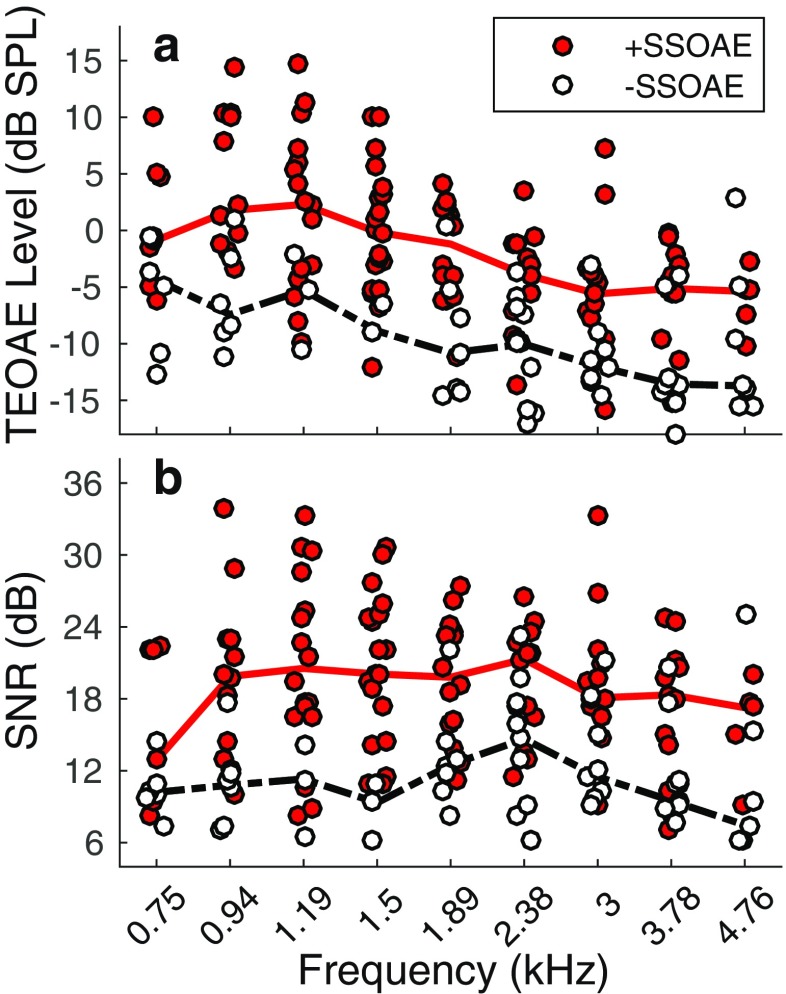
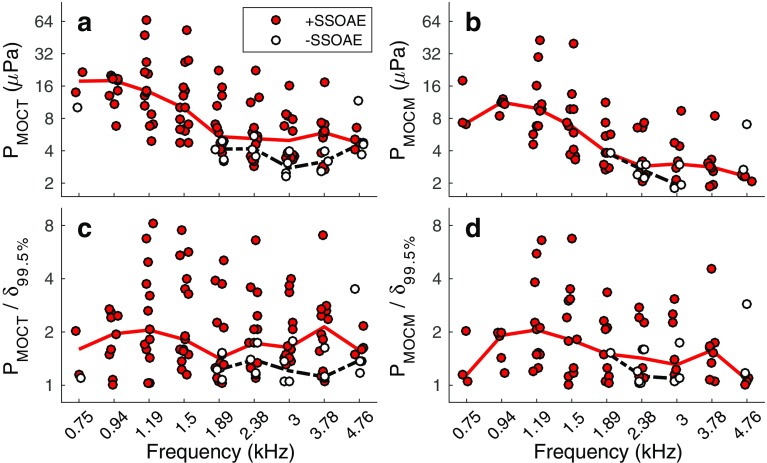
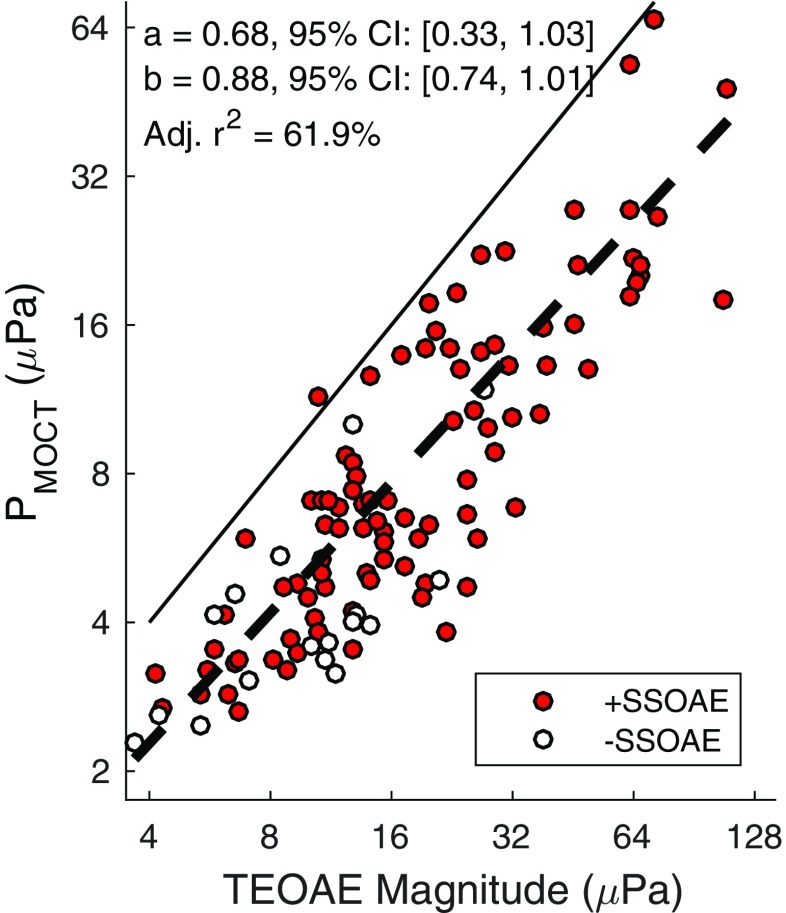
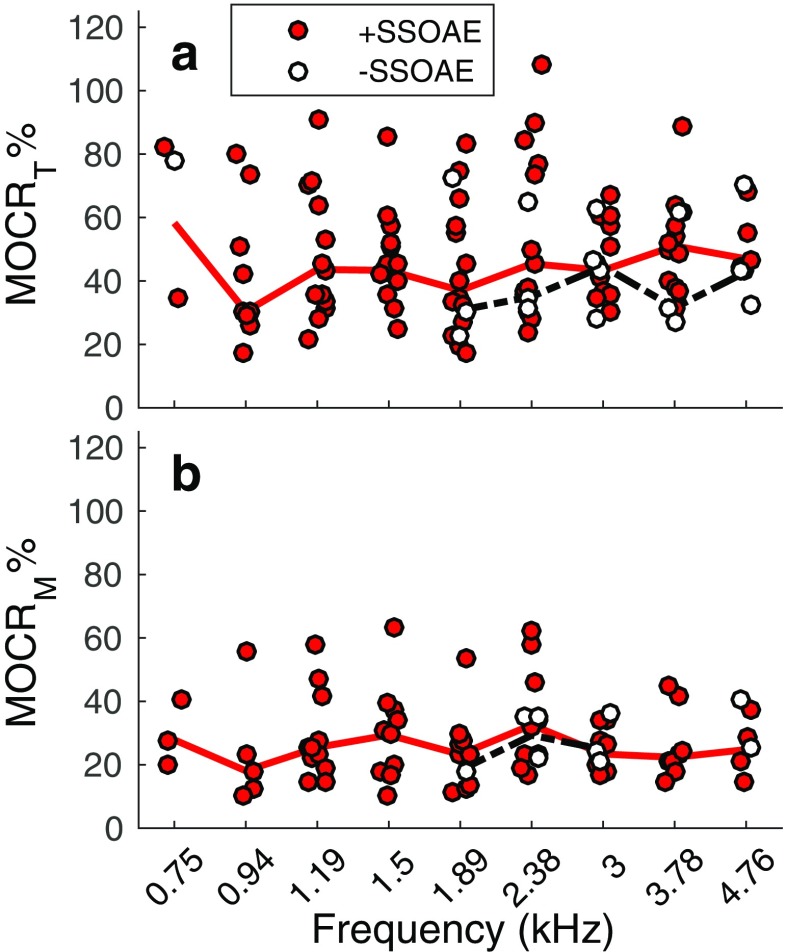
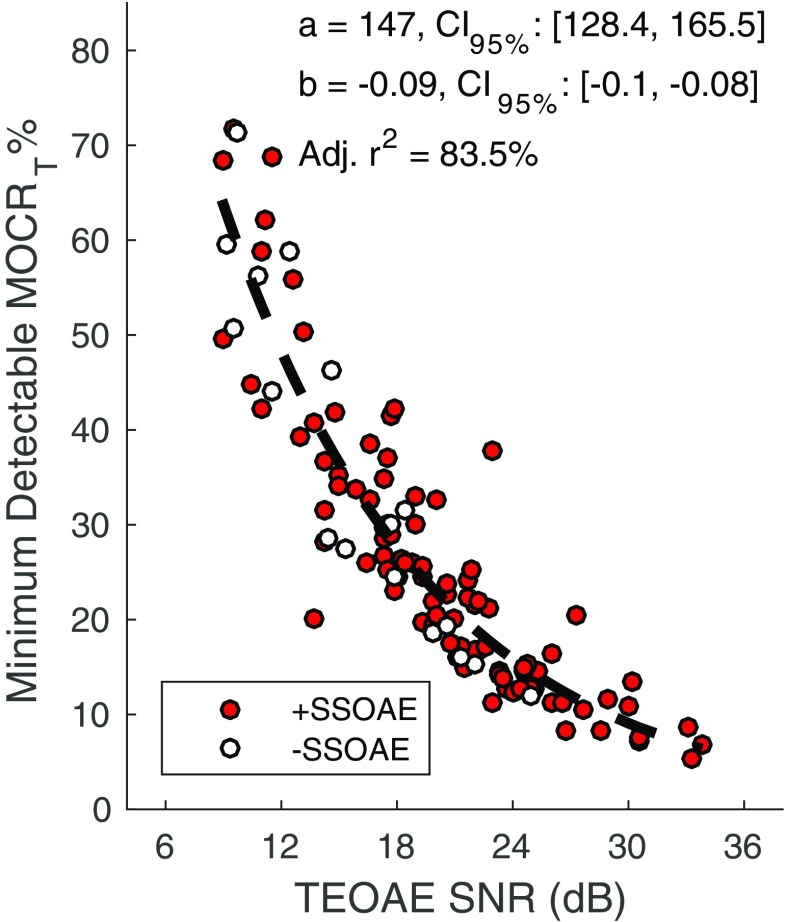
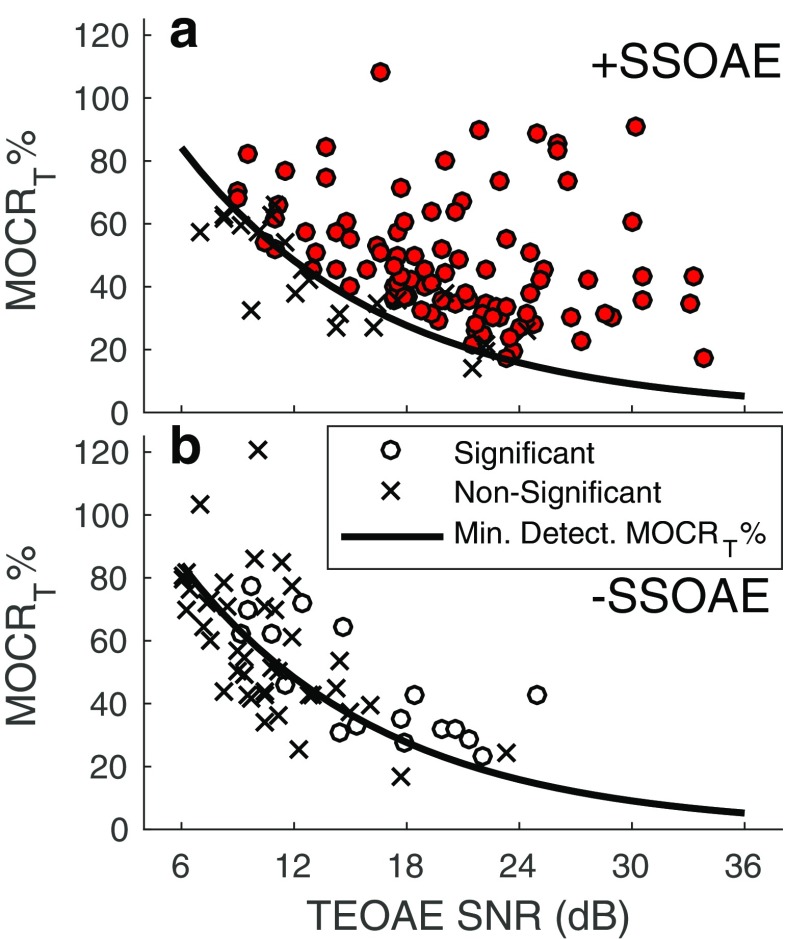
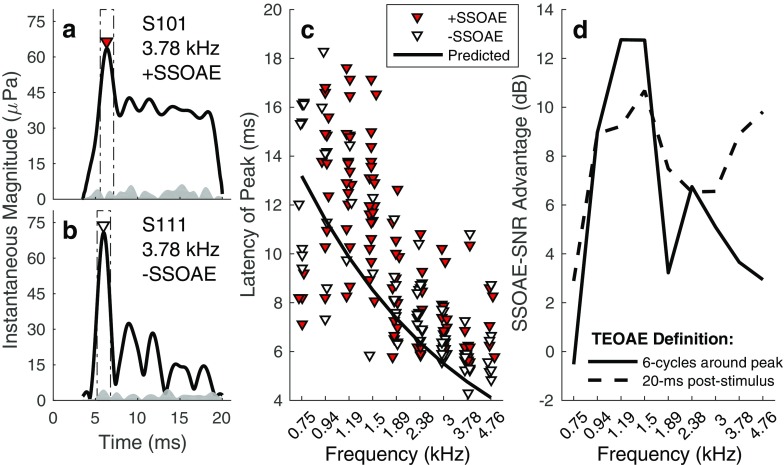
Detection of medial olivocochlear-induced (MOC) changes to transient-evoked otoacoustic emissions (TEOAE) requires high signal-to-noise ratios (SNR). TEOAEs associated with synchronized spontaneous (SS) OAEs exhibit higher SNRs than TEOAEs in the absence of SSOAEs, potentially making the former well suited for MOC assays. Although SSOAEs may complicate interpretation of MOC-induced changes to TEOAE latency, recent work suggests SSOAEs are not a problem in non-latency-dependent MOC assays. The current work examined the potential benefit of SSOAEs in TEOAE-based assays of the MOC efferents. It was hypothesized that the higher SNR afforded by SSOAEs would permit detection of smaller changes to the TEOAE upon activation of the MOC reflex. TEOAEs were measured in 24 female subjects in the presence and absence of contralateral broadband noise. Frequency bands with and without SSOAEs were identified for each subject. The prevalence of TEOAEs and statistically significant MOC effects were highest in frequency bands that also contained SSOAEs. The median TEOAE SNR in frequency bands with SSOAEs was approximately 8 dB higher than the SNR in frequency bands lacking SSOAEs. After normalizing by TEOAE amplitude, MOC-induced changes to the TEOAE were similar between frequency bands with and without SSOAEs. Smaller MOC effects were detectable across a subset of the frequency bands with SSOAEs, presumably due to a higher TEOAE SNR. These findings demonstrate that SSOAEs are advantageous in assays of the MOC reflex.
Keywords: auditory efferent system; cochlear processing; female; normal hearing.
Conflict of interest statement
Conflict of Interest
The author declares that he has no conflict of interest.
Figures
Similar articles
-
Contralateral suppression of otoacoustic emissions in pre-school children.Int J Pediatr Otorhinolaryngol. 2020 May;132:109915. doi: 10.1016/j.ijporl.2020.109915. Epub 2020 Jan 30. Int J Pediatr Otorhinolaryngol. 2020. PMID: 32028191
-
Olivocochlear Efferent Activity Is Associated With the Slope of the Psychometric Function of Speech Recognition in Noise.Ear Hear. 2018 May/Jun;39(3):583-593. doi: 10.1097/AUD.0000000000000514. Ear Hear. 2018. PMID: 29135685 Free PMC article.
-
Medial olivocochlear reflex effects on synchronized spontaneous otoacoustic emissions.J Acoust Soc Am. 2020 Mar;147(3):EL235. doi: 10.1121/10.0000886. J Acoust Soc Am. 2020. PMID: 32237820
-
Olivocochlear efferents: anatomy, physiology, function, and the measurement of efferent effects in humans.Ear Hear. 2006 Dec;27(6):589-607. doi: 10.1097/01.aud.0000240507.83072.e7. Ear Hear. 2006. PMID: 17086072 Review.
-
Olivocochlear efferents: Their action, effects, measurement and uses, and the impact of the new conception of cochlear mechanical responses.Hear Res. 2018 May;362:38-47. doi: 10.1016/j.heares.2017.12.012. Epub 2017 Dec 21. Hear Res. 2018. PMID: 29291948 Free PMC article. Review.
Cited by
-
Fluctuations of Otoacoustic Emissions and Medial Olivocochlear Reflexes: Tracking One Subject over a Year.Audiol Res. 2022 Sep 14;12(5):508-517. doi: 10.3390/audiolres12050051. Audiol Res. 2022. PMID: 36136858 Free PMC article.
-
The Reliability of Contralateral Suppression of Otoacoustic Emissions Is Greater in Women than in Men.Audiol Res. 2022 Jan 19;12(1):79-86. doi: 10.3390/audiolres12010008. Audiol Res. 2022. PMID: 35200258 Free PMC article.
-
No Change in Medial Olivocochlear Efferent Activity during an Auditory or Visual Task: Dual Evidence from Otoacoustic Emissions and Event-Related Potentials.Brain Sci. 2020 Nov 23;10(11):894. doi: 10.3390/brainsci10110894. Brain Sci. 2020. PMID: 33238438 Free PMC article.
-
A Time-Course-Based Estimation of the Human Medial Olivocochlear Reflex Function Using Clicks.Front Neurosci. 2021 Oct 28;15:746821. doi: 10.3389/fnins.2021.746821. eCollection 2021. Front Neurosci. 2021. PMID: 34776849 Free PMC article.
-
Medial olivocochlear reflex effects on amplitude growth functions of long- and short-latency components of click-evoked otoacoustic emissions in humans.J Neurophysiol. 2021 May 1;125(5):1938-1953. doi: 10.1152/jn.00410.2020. Epub 2021 Feb 24. J Neurophysiol. 2021. PMID: 33625926 Free PMC article.
References
-
- Burns EM, Strickland EA, Tubis A, Jones K. (1984) Interactions among spontaneous otoacoustic emissions. I. Distortion products and linked emissions. Hear Res 16(3):271-278. - PubMed
MeSH terms
LinkOut - more resources
Full Text Sources
Other Literature Sources
Miscellaneous
